ajax loader

Loading...


Ride-the-Wave Strategy – Best for Stock Traders

Ride-the-Wave targets multi-day price momentum following a company’s earnings announcement (EA). With this strategy:

  1. Buy a stock one day post-EA if a stock reacts positively post-earnings:
    1. Near the close of trading the EA-day for a pre-market-EA
    2. Near the close of the following day for a post-market-EA
  2. Sell-to-close after 7-10 days, or possibly earlier if a desired price target is reached

Similarly,

  1. short a stock one day post-EA if a stock reacts negatively post-earnings:
    1. near the close of trading the EA-day for a premarket-EA
    2. near the close of the following day for a post-market-EA
  2. then buy-to-close after 7-10 days, or possibly earlier if a desired price target is reached

Important: Ride-the-Wave is predicated on significant price momentum triggered by an EA. The 7-10 day scenario is the maximum trade hold-time. If you see post EA-momentum is halted or reversed by a significant opposite move, re-evaluate your presence in the trade.

This popular StockEarnings screen below will give you a list of stocks that historically exhibit significant price momentum following an EA for the next seven days:

  1. Stocks exhibiting positive post-EA price moves are buy-candidates
  2. Stocks exhibiting negative post-EA price moves are sell/short-candidates

The screen includes those stocks whose Earnings just came out in last two days.

Screen criteria:

  1. Earnings Date Start Date : Current Date + -1 Day
  2. Earnings Date End Date : Current Date + -2 Days
  3. Predicted Move (Next Day) Max : 7%
  4. Predicted Move (On 7th Day) Min : 7%

Strategy Guideline:

  1. Buy the stock if stock has reacted positively. Short the stock if stock has reacted negatively (see above).
  2. Close the position in 7-10 days, or possibly earlier based on price move.

Volatility Crush Strategy - Best for Options Traders

The Volatility Crush strategy is used with stocks that typically experience relatively low-to-moderate price moves (≤4%) following their Earnings Announcements (EA). The basic trade idea is to sell put or call options right before the EA, collecting a credit when options premium is very high due to elevated implied volatility (IV). You then close the position right after the EA by buying the option back much cheaper due to the significant drop in IV that occurs after the mystery of the EA disappears. In assessing this trade, you need to do your homework to ensure you collect sufficient premium to make the trade worthwhile.

This trade is practical due to the low-to-moderate price-move after the EA, which generally won’t significantly affect the options price, unlike an “action” stock, which experience great price moves post-EA. With these symbols, if you’re on the right side of the price move, that’s a great thing. But if you’re on the wrong side of the move, not so great. Consequently, by minimizing the effect of the post-EA price move, you have a much better chance to profit from the reduction in IV without it being ruined by a violent price move.

For this trade, open the position either (1) the night before the EA when the company announces earnings or (2) during the EA day when it announces post-market, generally capturing IV at or close to its peak.

For this trade, open the position either (1) the night before the EA when the company announces earnings or (2) during the EA day when it announces post-market, generally capturing IV at or close to its peak.

This popular stockearnings screen will give you a list of stocks which do not react more than 4% fpost-EA. It includes only those stocks whose earnings are releasing next day.

Screen criteria:

  1. Earnings Date Start Date : Current Date + 1
  2. Earnings Date End Date : Current Date + 1
  3. Predicted Move (Next Day) Max : 4%
  4. Options Type: Weekly

Strategy Guideline:

  1. Options Strategy: Sell Call and Put
  2. Options Strike Price: Current Stock Price – (% Predicated Move x 2)
  3. Expiration Date: It should generally be the closest expiry immediately after the EA.
  4. Buy Insurance: Buying back Call and Put at Strike price which 10% lower than Sell Strike Price is optional but recommended.

Watch Video for More Detail

Volatility Rush Strategy - Best for Options Traders

The Volatility Rush takes advantage of increasing options premiums into earnings announcements (EA) caused by an anticipated rise in Implied Volatility (IV). With this strategy, Buy a Call and Put at-the-money (a long straddle) 2-3 weeks before the EA when IV is lower. Sell the position either (1) the night before the EA when the company announces earnings pre-market, or (2) during the EA day when it announces post-market, generally capturing IV at or close to its peak.

This popular screen will give you a list of stocks whose Options premiums tend to rise into Earnings. It includes only those stocks whose Earnings are at least two weeks away from today.

Screen criteria:

  1. Earnings Date Start Date : Current Date + 15 Days
  2. Earnings Date End Date : Current Date + 30 Days
  3. Predicted Move (Next Day) Min : 5%
  4. Options Type: Weekly or Monthly if that lines up with the two to three-week lead-time for entering the trade

Strategy Guideline:

  1. Buy a Straddle at or close to the money two to three weeks pre-EA.
  2. Sell the position either the night before the EA when the company announces earnings pre-market, or during the EA day when it announces post-market.
  3. Expiration date should generally be the closest expiry immediately after the EA.
  4. Straddle price should not be more 60% of predicted move.

Predicted Move (Volatility)

Similar to Implied Volatility in Options. Expected volatility % based on our Proprietary Volatility Predication Model. We are expecting that stock price will likely to reach % in either direction by the end of next trading session after Earnings are released and not necessarily the closing volatility %.

Why is it important?

    This indicator helps

  1. Knowing expected volatility in stocks after Earnings helps to decide trading stocks before Earnings Announcement.
  2. Taking Advantage of volatility collapse following Earnings Results by using Advance Options strategies such as Spread and Straddles.

Since Last Earnings

Change in share price since last Earnings release.

Why is it Important?

When share has gained more than 10% since it's last Earning release, it tends to over react to minor bad news and give up some gains if not all. So, it contains more downside volatility than upside When share has dropped more than 10% since it's last Earning release, it tends to over react to minor good news and recover some drops if not all. So, it contains more upside volatility than downside.

EPS Surprise (%)

Occurs when a company's reported quarterly or annual profits are above or below analysts' expectations. Here is the formula to derive % EPS Surprice:

Actual EPS - Estimated EPS
------------------------------------- x 100
Estimated EPS

Why is it Important?

Earnings surprises can have a huge impact on a company's stock price. Several studies suggest that positive earnings surprises not only lead to an immediate hike in a stock's price, but also to a gradual increase over time. Hence, it's not surprising that some companies are known for routinely beating earning projections. A negative earnings surprise will usually result in a decline in share price.

Next Day Price Change (%)

Next Regular trading session Closing price following Earnings result.

For After Market Close Earnings, It is a next trading day closing price. For Before Market Open Earnings, It is the same trading day closing price.

Why is it Important?

Next Day price change is a reaction of Earnings result.

Dave & Buster’s Earnings Report: Why The Stock Spiked Despite Poor Earnings

Posted on Apr 07, 2026 by Grayson Cavern

Dave & Buster’s Earnings Report: Why The Stock Spiked Despite Poor Earnings

Dave & Buster’s Entertainment, Inc., (NASDAQ: PLAY). stock initially spiked following its fiscal fourth-quarter 2025 earnings release, despite reporting a loss of -$1.15 per share compared to -$0.24 a year ago and delivering another quarter of declining comparative sales. However, rather than building on that momentum, the stock failed to hold its gains, pulled back, and settled into a period of consolidation. The question is: what’s driving the optimism?

The Numbers Don’t Lie, And They’re Not Pretty


The arcade and gaming company, Dave & Buster’s, reported Q4 revenue of $529.60 million, down from $534.60 million a year ago, a $5 million decline, less than 1%. On the surface, that looks manageable. But peel back the layer and the real story emerges.

Comparable store sales, the clearest measure of organic demand, fell 3.3% year-over-year. Management noted that, excluding the impact of Winter Storm Fern in January, the decline would have been approximately 1.5%.

Either way, existing locations are generating less revenue than they were a year ago. Revenue per store dropped from $180 to $169 per week, a 6.1% decline, more than six times the rate of total revenue decline. That gap shows that the weakness isn’t spread thin across the business; instead, it’s concentrated inside the stores.

Empty Arcade Machines Tell the Real Story

As stated above, this isn’t a one-quarter blip. After missing earnings three times in one year, it’s a pattern that’s forced investors to question the relevance of Dave & Buster’s in today’s entertainment landscape.

From its beginnings, the brand built its identity on a simple but powerful idea: eat, drink, play, and watch, all under one roof. Across 175 locations in 43 states, Puerto Rico, and Canada, that concept once drove real traffic and real loyalty. However, customer sentiment is shifting. Feedback points to a declining overall experience: higher perceived costs, a less engaging in-store environment, and an atmosphere that feels flat compared to what the brand once delivered.

It follows that when customers stop seeing value in the experience, visits and time spent in stores decline, and spending patterns change.

That’s exactly what the numbers show. Entertainment revenue, the primary traffic driver and the whole point of the brand, fell from $335 million to $313 million, a $22 million or 6.6% drop. Meanwhile, food and beverage revenue, which accounts for 40.9% of total revenues, grew 8.5% to $216.6 million.

The “few” customers who still visit Dave & Buster’s are eating and drinking. They’re just not playing. And for a brand whose entire identity is built around the arcade experience, their primary revenue driver, that’s a dreadful distinction and a serious problem.

A CEO With a Plan, And a Lot to Prove

The silver lining in this report isn’t in the numbers. It’s in the strategy.

After almost a year in office, CEO Tarun Lal and the team have been direct about the path forward: a back-to-basics approach focused on improved marketing, menu upgrades, and rolling out at least 10 new games and attractions in fiscal year 2026. The company has also remodeled 51 stores since the initiative launched, with 11 new locations opened this year alone.

The early results are selective but real. Food and beverage revenue is up 7% under the new focus. And management’s guidance points to positive comparable store sales, EBITDA growth, and $100 million in free cash flow for fiscal 2026.

Granted, the back-to-basics strategy has enough pull to give investors something to hold onto, which explains the stock’s post-earnings behavior. But while the optimism is real, it’s narrative-driven, not yet result-driven.

The Technical Analysis At “Play”

The stock’s price action reinforces this disconnect between narrative and reality. Heading into earnings, Dave & Buster’s was trading around $10.80. On the release, PLAY surged sharply to about $13.20-$13.40, a move of about 20%, reflecting an immediate reaction to the company’s expectations rather than the underlying fundamentals.
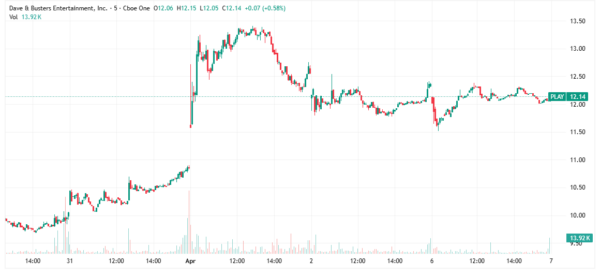
Dave & Buster's - StockEarnings

But the move didn’t hold as the stock pulled back to about $12.20, giving up almost 9% from its peak. Since then, it has settled into a tight consolidation with no strong market conviction. Taken together, the spike shows optimism, but the recent, consistent decline could send the stock falling soon.

Everyone Loves a Good Turnaround Story Until…

Dave & Buster’s is being priced as a recovery play. The CEO has a plan, the remodels are underway, and guidance is optimistic. But the core product is still losing customers, the stores are generating less per week, and the entertainment segment that defines the brand continues to shrink.

Until traffic stabilizes, the in-store experience improves, and entertainment demand recovers, the turnaround remains a narrative, not a result. And that gap between what’s being priced in and what’s actually showing up in the numbers is exactly where the risk lives, or better put, where the bears come in.


Join over 1.2M+ investors/traders who receive daily and weekly notable earnings alerts with predicted move