ajax loader

Loading...


Ride-the-Wave Strategy – Best for Stock Traders

Ride-the-Wave targets multi-day price momentum following a company’s earnings announcement (EA). With this strategy:

  1. Buy a stock one day post-EA if a stock reacts positively post-earnings:
    1. Near the close of trading the EA-day for a pre-market-EA
    2. Near the close of the following day for a post-market-EA
  2. Sell-to-close after 7-10 days, or possibly earlier if a desired price target is reached

Similarly,

  1. short a stock one day post-EA if a stock reacts negatively post-earnings:
    1. near the close of trading the EA-day for a premarket-EA
    2. near the close of the following day for a post-market-EA
  2. then buy-to-close after 7-10 days, or possibly earlier if a desired price target is reached

Important: Ride-the-Wave is predicated on significant price momentum triggered by an EA. The 7-10 day scenario is the maximum trade hold-time. If you see post EA-momentum is halted or reversed by a significant opposite move, re-evaluate your presence in the trade.

This popular StockEarnings screen below will give you a list of stocks that historically exhibit significant price momentum following an EA for the next seven days:

  1. Stocks exhibiting positive post-EA price moves are buy-candidates
  2. Stocks exhibiting negative post-EA price moves are sell/short-candidates

The screen includes those stocks whose Earnings just came out in last two days.

Screen criteria:

  1. Earnings Date Start Date : Current Date + -1 Day
  2. Earnings Date End Date : Current Date + -2 Days
  3. Predicted Move (Next Day) Max : 7%
  4. Predicted Move (On 7th Day) Min : 7%

Strategy Guideline:

  1. Buy the stock if stock has reacted positively. Short the stock if stock has reacted negatively (see above).
  2. Close the position in 7-10 days, or possibly earlier based on price move.

Volatility Crush Strategy - Best for Options Traders

The Volatility Crush strategy is used with stocks that typically experience relatively low-to-moderate price moves (≤4%) following their Earnings Announcements (EA). The basic trade idea is to sell put or call options right before the EA, collecting a credit when options premium is very high due to elevated implied volatility (IV). You then close the position right after the EA by buying the option back much cheaper due to the significant drop in IV that occurs after the mystery of the EA disappears. In assessing this trade, you need to do your homework to ensure you collect sufficient premium to make the trade worthwhile.

This trade is practical due to the low-to-moderate price-move after the EA, which generally won’t significantly affect the options price, unlike an “action” stock, which experience great price moves post-EA. With these symbols, if you’re on the right side of the price move, that’s a great thing. But if you’re on the wrong side of the move, not so great. Consequently, by minimizing the effect of the post-EA price move, you have a much better chance to profit from the reduction in IV without it being ruined by a violent price move.

For this trade, open the position either (1) the night before the EA when the company announces earnings or (2) during the EA day when it announces post-market, generally capturing IV at or close to its peak.

For this trade, open the position either (1) the night before the EA when the company announces earnings or (2) during the EA day when it announces post-market, generally capturing IV at or close to its peak.

This popular stockearnings screen will give you a list of stocks which do not react more than 4% fpost-EA. It includes only those stocks whose earnings are releasing next day.

Screen criteria:

  1. Earnings Date Start Date : Current Date + 1
  2. Earnings Date End Date : Current Date + 1
  3. Predicted Move (Next Day) Max : 4%
  4. Options Type: Weekly

Strategy Guideline:

  1. Options Strategy: Sell Call and Put
  2. Options Strike Price: Current Stock Price – (% Predicated Move x 2)
  3. Expiration Date: It should generally be the closest expiry immediately after the EA.
  4. Buy Insurance: Buying back Call and Put at Strike price which 10% lower than Sell Strike Price is optional but recommended.

Watch Video for More Detail

Volatility Rush Strategy - Best for Options Traders

The Volatility Rush takes advantage of increasing options premiums into earnings announcements (EA) caused by an anticipated rise in Implied Volatility (IV). With this strategy, Buy a Call and Put at-the-money (a long straddle) 2-3 weeks before the EA when IV is lower. Sell the position either (1) the night before the EA when the company announces earnings pre-market, or (2) during the EA day when it announces post-market, generally capturing IV at or close to its peak.

This popular screen will give you a list of stocks whose Options premiums tend to rise into Earnings. It includes only those stocks whose Earnings are at least two weeks away from today.

Screen criteria:

  1. Earnings Date Start Date : Current Date + 15 Days
  2. Earnings Date End Date : Current Date + 30 Days
  3. Predicted Move (Next Day) Min : 5%
  4. Options Type: Weekly or Monthly if that lines up with the two to three-week lead-time for entering the trade

Strategy Guideline:

  1. Buy a Straddle at or close to the money two to three weeks pre-EA.
  2. Sell the position either the night before the EA when the company announces earnings pre-market, or during the EA day when it announces post-market.
  3. Expiration date should generally be the closest expiry immediately after the EA.
  4. Straddle price should not be more 60% of predicted move.

Predicted Move (Volatility)

Similar to Implied Volatility in Options. Expected volatility % based on our Proprietary Volatility Predication Model. We are expecting that stock price will likely to reach % in either direction by the end of next trading session after Earnings are released and not necessarily the closing volatility %.

Why is it important?

    This indicator helps

  1. Knowing expected volatility in stocks after Earnings helps to decide trading stocks before Earnings Announcement.
  2. Taking Advantage of volatility collapse following Earnings Results by using Advance Options strategies such as Spread and Straddles.

Since Last Earnings

Change in share price since last Earnings release.

Why is it Important?

When share has gained more than 10% since it's last Earning release, it tends to over react to minor bad news and give up some gains if not all. So, it contains more downside volatility than upside When share has dropped more than 10% since it's last Earning release, it tends to over react to minor good news and recover some drops if not all. So, it contains more upside volatility than downside.

EPS Surprise (%)

Occurs when a company's reported quarterly or annual profits are above or below analysts' expectations. Here is the formula to derive % EPS Surprice:

Actual EPS - Estimated EPS
------------------------------------- x 100
Estimated EPS

Why is it Important?

Earnings surprises can have a huge impact on a company's stock price. Several studies suggest that positive earnings surprises not only lead to an immediate hike in a stock's price, but also to a gradual increase over time. Hence, it's not surprising that some companies are known for routinely beating earning projections. A negative earnings surprise will usually result in a decline in share price.

Next Day Price Change (%)

Next Regular trading session Closing price following Earnings result.

For After Market Close Earnings, It is a next trading day closing price. For Before Market Open Earnings, It is the same trading day closing price.

Why is it Important?

Next Day price change is a reaction of Earnings result.

TJX Q1 Earnings: Great Numbers, But What Does It Signal?

Posted on May 21, 2026 by Chris Markoch

TJX Q1 Earnings: Great Numbers, But What Does It Signal?

TJX Companies (NYSE: TJX) delivered a blowout first quarter on May 20, posting results that beat on every major metric. Net sales of $14.3 billion rose 9% year-over-year, comparable sales jumped 6% across all divisions, and diluted earnings per share of $1.19 came in 29% above the same period last year and well ahead of the company’s own guidance.

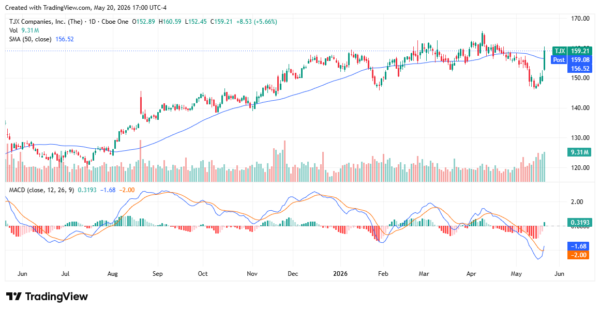
TJX also raised its full-year fiscal 2027 outlook accordingly, bumping EPS guidance to $5.08–$5.15 and upping its share buyback authorization to $2.75–$3.0 billion. The stock surged more than 5% on the news, closing at $159.21 — just above its 50-day moving average of $156.52.

However, investors should read the fine print. When they do, here’s the part that should give the broader market pause: TJX thrives when consumers are under pressure. The off-price model (i,e., offering brand-name and designer merchandise at 20% to 60% below full-price retail) is built for economic stress.

When households feel the squeeze of persistent inflation, elevated interest rates, and slowing wage growth, they trade down. They find T.J. Maxx and Marshalls. A blowout quarter for TJX isn’t necessarily a vote of confidence in the American consumer — it may be closer to the opposite. The treasure-hunt experience is compelling on its own, but the tailwind here is macroeconomic anxiety, not prosperity.

The Best House in a Bad Retail Neighborhood


The comparison to full-price retail tells a stark story. While department stores and specialty retailers have struggled with excess inventory, shifting consumer habits, and margin compression, TJX has consistently grown its store count, traffic, and profitability. This quarter, HomeGoods led the way with a remarkable 9% comp sales gain in the U.S., while TJX Canada posted a 7% comp sales gain. TJX International, covering Europe and Australia, grew 4% on a comparable basis despite currency headwinds — a meaningful feat given the economic softness in the UK and continental Europe.

The company added 48 net new stores during the quarter, bringing its total to 5,262 locations across 10 countries. Segment profit rose in every division: Marmaxx grew to $1.269 billion, HomeGoods nearly matched prior-year levels, and international operations continued to gain traction. TJX is not just surviving in a tough retail environment — it is systematically expanding while others retreat. That positioning — well-capitalized, operationally disciplined, and structurally advantaged relative to full-price peers — makes it arguably the strongest franchise in brick-and-mortar retail today.

Growth Is Priced In — And That’s the Risk

The stock’s reaction tells a nuanced story. A 5.66% single-day gain on earnings this strong might seem modest given the magnitude of the beat, but TJX was already pricing in excellence. The stock had traded near all-time highs before a broader market pullback pushed it below its 50-day average — from which it snapped back sharply on Wednesday. With full-year EPS guidance of roughly $5.08–$5.15 and the stock trading near $159, investors are paying approximately 31 times forward earnings for a retailer, however exceptional it may be.

TJX’s full-year guidance also came with a notable caveat: the company is explicitly not flowing through the full Q1 beat to the annual outlook. Management cited the expectation of higher fuel costs for the remainder of the year as a headwind to margins — a reminder that even TJX cannot fully insulate itself from commodity and supply chain volatility. For growth to continue surprising to the upside, the macro environment will need to cooperate, or at a minimum, not deteriorate further.

Technical Analysis: Momentum Returning After a Rough April

The chart tells a compelling near-term recovery story. After peaking around the $165–$168 range in late winter, TJX sold off through April and into early May, pulling well below its 50-day simple moving average of $156.52. The MACD indicator had diverged deeply negative — the signal line falling to -2.00 — signaling weakening momentum. Wednesday’s earnings-driven surge pushed the stock back above the 50-day, with a MACD that is beginning to curl back toward neutral. Volume of 9.31 million shares was well above recent averages, confirming conviction behind the move. The recovery breakout is early-stage but technically constructive.
tjx - StockEarnings

Why the Stock Could Have More Upside

Walmart (NASDAQ: WMT) reports on May 21, and its results could provide a meaningful tailwind or headwind for TJX. If Walmart reinforces the narrative of the value-seeking consumer, TJX benefits from the same thematic trade. If Walmart disappoints, it may signal a consumer more stressed than the TJX results imply, putting both names under pressure.

Looking further out, there are structural reasons to stay constructive on TJX. The company generated $1.1 billion in operating cash flow in Q1 alone, ending the period with $5.6 billion in cash. It is actively buying back stock at scale, pays a growing dividend (declared at $0.48 per share this quarter, versus $0.425 a year ago), and has a long runway for international expansion — particularly in Europe, where TK Maxx remains underpenetrated relative to the U.S. market. JPMorgan recently raised its price target to $174, suggesting roughly 9% additional upside from current levels. Analysts at Truist also cited TJX alongside Ross Stores as off-price leaders positioned for continued outperformance.

Conclusion: A High-Quality Franchise at a Premium Price

TJX Companies has earned its reputation as one of the most resilient and well-run retailers in the world. Over any meaningful time horizon — three years, five years, a decade — it has delivered strong total returns, driven by consistent comparable sales growth, expanding margins, and disciplined capital allocation. This quarter was no exception: 6% comp growth, a 1.7 percentage point expansion in pretax profit margins, and earnings per share up nearly 30% year-over-year are exceptional results by any standard.

But the near-term outlook for TJX — like every consumer-facing business — hinges on variables entirely outside its control: the Federal Reserve’s rate trajectory, the stickiness of core inflation, and oil prices. These factors shape the consumer’s mood, spending capacity, and propensity to trade down into off-price retail.

TJX benefits from the first two remaining elevated and suffers if the third spikes. Whether this is the best house in a bad retail neighborhood is almost beside the point — it is certainly the house most likely to hold its value when the neighborhood gets rough. For long-term investors comfortable paying a premium for quality and consistency, that may be reason enough to own it.


A former marketing copywriter turned freelance financial writer and market analyst. I have a passion for delivering insights to investors. I write regularly about stocks for StockEarnings and MarketBeat. Posts are not advice.

Join over 1.2M+ investors/traders who receive daily and weekly notable earnings alerts with predicted move