We need to talk about AST SpaceMobile (NASDAQ: ASTS), a name with which I have a love-hate relationship. On Sep. 2, I discussed ASTS stock, mentioning that its second-quarter earnings meltdown provided a contrarian opportunity. Given that the ticker had jumped nearly 6% for the Sep. 17 session, that should be exactly what I wanted, right?
Well, not quite. Yes, I do appreciate that ASTS stock popped, as my Markov chain analysis suggested might happen. That does add credibility to the model but the problem was that I conducted my analysis a day earlier. Further, the data implied that a robust swing would likely occur in the later weeks.
Instead, on Sep. 2 — the day of publication — ASTS stock moved higher. And it didn’t just move but gap up and later skyrocket. When the dust cleared on that session, the ticker had gained nearly 12%. It’s hard to call it a win when the idea that I had focused on was the 55/60 bull call spread expiring Oct. 16.
At the close of the troublesome session, AST SpaceMobile stock stood at $62.40. I was basing my analysis of the 55/60 bull spread using a reference price of $55.80. So, with the new spot price well above the second-leg strike of my desired options play, the narrative became almost irrelevant.
Obviously, the options market moves like crazy — and written publications are not always ideal because they have to go through a standard editing process before being released to the public. If you want data-based forecasts as soon as I identify them, you may check out my YouTube channel @MarkovSimulator.
Still, I want to refocus on AST SpaceMobile stock because I still believe speculators who missed the earlier run may still have a chance at upside. Indeed, I would even go so far as to say that the relative risk may be overpriced.
A Possible Mispricing with ASTS Stock?
Did I really say that? Yes, there may be a favorable mispricing with AST SpaceMobile stock call spreads, but it comes with a heavy caveat. I don’t mean favorable in an absolute sense. Rather, I’m talking in terms of relative scales. Because AST has a 60-month beta of 2.74, it is wildly more volatile than the benchmark S&P 500 index.
However, how the underlying call spreads are priced carries a certain risk implication. While ASTS stock may be unusually risky compared to a blue chip, the pricing that it currently enjoys may be somewhat inefficient — possibly in your favor.
Let’s look at the 65/70 bull call spread expiring Oct. 16 as an example. Here, AST SpaceMobile stock must trigger the $70 second-leg strike at expiration. Doing so would convert the $158 net debit (cash outlay) into a maximum profit of $342, a payout of over 216%.
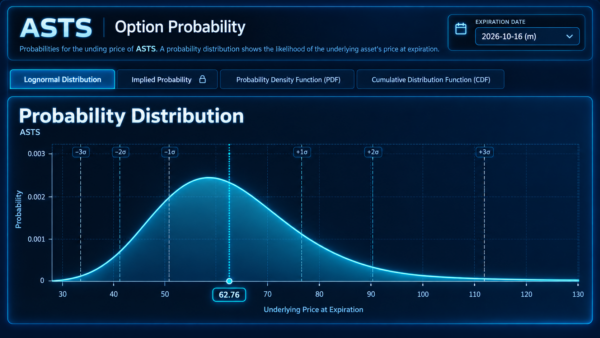
That sounds incredibly tempting but there’s a catch: Wall Street believes that there’s only a 38.1% chance that ASTS stock will break even at $66.58 (at expiration). Even worse, OptionCharts’ Probability Distribution screener states that the odds of ASTS triggering the $70 strike sit at only 26.33%.
Obviously, running a quick expected value calculation will yield a problematic trajectory. Playing this exact hand across multiple parallel universes will quickly sink your portfolio as the number of losses outpaces the number of wins. Therefore, any reputable financial advisor will direct your attention away from the October-monthly 65/70 bull spread.
However, we need to ask important, probing questions before making a final decision.
All Future Forecasts are Presuppositional
It may sound like a point not worth stating but it needs to be said: all forecasts of the unknown future are necessarily presuppositional. It doesn’t matter the source of the forecast, whether that be from a Wall Street institution, a mathematical screener or some random guy on the internet.
Understanding this concept forces us to ask, what presuppositions were baked into the calculation of the above probabilities? Basically, the answer is Black-Scholes, which presupposes that given the current spot price and the assumed magnitude of volatility, the target security will undergo a random walk between now and the expiration date.
A critical epistemological cost associated with such a random-walk framework is that the future is independent of the past. In other words, it doesn’t matter how ASTS stock arrived at the time-of-writing price of $62.71. Once a price has been established, the framework integrates the current implied volatility and produces a probabilistic output based on random price discovery.
However, most of us (if not all of us) believe that the future is dependent on the past. Take, for example, the disciplines of fundamental and technical analysis. In both cases, analysts are looking at past data (whether that be financial statements or chart patterns) to project a likely path forward.
In the case of a Markov chain analysis, we’re looking at how specific states have higher transitional probabilities toward certain other states. My model (the Markov simulator) is simply a modulation of this principle for the equities market.
Identifying the Signal for AST SpaceMobile Stock
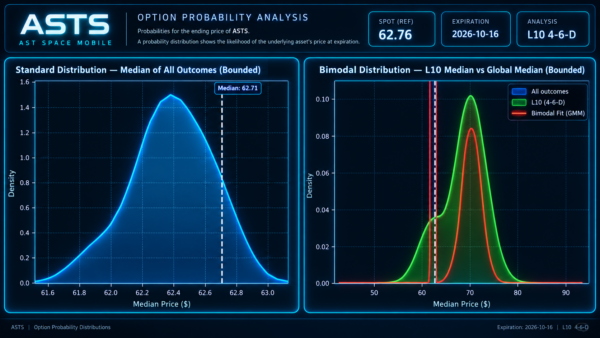
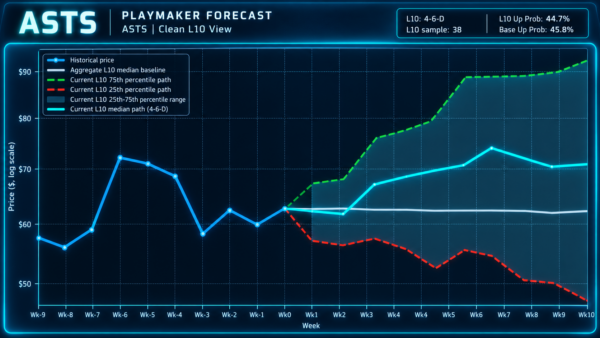
What’s interesting about ASTS stock is that, in the last 10 weeks, 60% of the weekly candlesticks were in the red, thus leading to a downward slope across the period. I discretize this quantitative state as the 4-6-D sequence, which simply means “4 up, 6 down, (D)ownward slope.”
Now that we have a discrete state, we can run a Markov simulation, using an algorithm to tabulate all occurrences of this signal going back to AST’s public market debut. It turns out that ASTS stock has flashed this sequence 38 times on a rolling basis. Of this tally, the ticker has exceeded the equivalent of the $70 strike 17 times on week 4 (coinciding with the Oct. 16 expiration date).
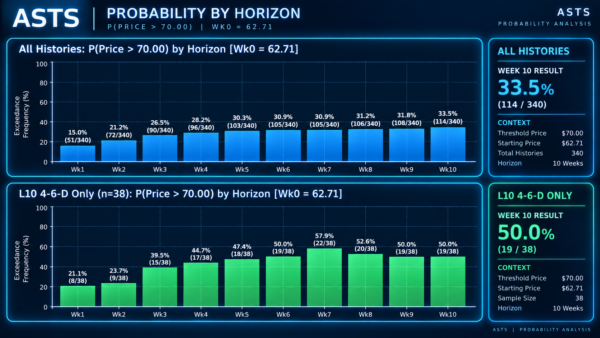
Granted, we’re talking about small sample sizes here so statistical confidence is low. Nevertheless, the observed probability of triggering the second-leg strike at expiration would appear to be 44.7%. While these are not great odds, they’re a lot better than the one calculated using a Black-Scholes derivative.
Best of all, if you find the month-of-October expiration date to be too aggressive, you may consider further-out dates. Even out to Nov. 20 (monthly), you can still get the 65/70 bull spread, which, if fully successful, will give you a maximum profit of over 122% (on a net debit of $225).
To reiterate, this is still a risky trade but there could be a potential opportunity.

