ajax loader

Loading...


Ride-the-Wave Strategy – Best for Stock Traders

Ride-the-Wave targets multi-day price momentum following a company’s earnings announcement (EA). With this strategy:

  1. Buy a stock one day post-EA if a stock reacts positively post-earnings:
    1. Near the close of trading the EA-day for a pre-market-EA
    2. Near the close of the following day for a post-market-EA
  2. Sell-to-close after 7-10 days, or possibly earlier if a desired price target is reached

Similarly,

  1. short a stock one day post-EA if a stock reacts negatively post-earnings:
    1. near the close of trading the EA-day for a premarket-EA
    2. near the close of the following day for a post-market-EA
  2. then buy-to-close after 7-10 days, or possibly earlier if a desired price target is reached

Important: Ride-the-Wave is predicated on significant price momentum triggered by an EA. The 7-10 day scenario is the maximum trade hold-time. If you see post EA-momentum is halted or reversed by a significant opposite move, re-evaluate your presence in the trade.

This popular StockEarnings screen below will give you a list of stocks that historically exhibit significant price momentum following an EA for the next seven days:

  1. Stocks exhibiting positive post-EA price moves are buy-candidates
  2. Stocks exhibiting negative post-EA price moves are sell/short-candidates

The screen includes those stocks whose Earnings just came out in last two days.

Screen criteria:

  1. Earnings Date Start Date : Current Date + -1 Day
  2. Earnings Date End Date : Current Date + -2 Days
  3. Predicted Move (Next Day) Max : 7%
  4. Predicted Move (On 7th Day) Min : 7%

Strategy Guideline:

  1. Buy the stock if stock has reacted positively. Short the stock if stock has reacted negatively (see above).
  2. Close the position in 7-10 days, or possibly earlier based on price move.

Volatility Crush Strategy - Best for Options Traders

The Volatility Crush strategy is used with stocks that typically experience relatively low-to-moderate price moves (≤4%) following their Earnings Announcements (EA). The basic trade idea is to sell put or call options right before the EA, collecting a credit when options premium is very high due to elevated implied volatility (IV). You then close the position right after the EA by buying the option back much cheaper due to the significant drop in IV that occurs after the mystery of the EA disappears. In assessing this trade, you need to do your homework to ensure you collect sufficient premium to make the trade worthwhile.

This trade is practical due to the low-to-moderate price-move after the EA, which generally won’t significantly affect the options price, unlike an “action” stock, which experience great price moves post-EA. With these symbols, if you’re on the right side of the price move, that’s a great thing. But if you’re on the wrong side of the move, not so great. Consequently, by minimizing the effect of the post-EA price move, you have a much better chance to profit from the reduction in IV without it being ruined by a violent price move.

For this trade, open the position either (1) the night before the EA when the company announces earnings or (2) during the EA day when it announces post-market, generally capturing IV at or close to its peak.

For this trade, open the position either (1) the night before the EA when the company announces earnings or (2) during the EA day when it announces post-market, generally capturing IV at or close to its peak.

This popular stockearnings screen will give you a list of stocks which do not react more than 4% fpost-EA. It includes only those stocks whose earnings are releasing next day.

Screen criteria:

  1. Earnings Date Start Date : Current Date + 1
  2. Earnings Date End Date : Current Date + 1
  3. Predicted Move (Next Day) Max : 4%
  4. Options Type: Weekly

Strategy Guideline:

  1. Options Strategy: Sell Call and Put
  2. Options Strike Price: Current Stock Price – (% Predicated Move x 2)
  3. Expiration Date: It should generally be the closest expiry immediately after the EA.
  4. Buy Insurance: Buying back Call and Put at Strike price which 10% lower than Sell Strike Price is optional but recommended.

Watch Video for More Detail

Volatility Rush Strategy - Best for Options Traders

The Volatility Rush takes advantage of increasing options premiums into earnings announcements (EA) caused by an anticipated rise in Implied Volatility (IV). With this strategy, Buy a Call and Put at-the-money (a long straddle) 2-3 weeks before the EA when IV is lower. Sell the position either (1) the night before the EA when the company announces earnings pre-market, or (2) during the EA day when it announces post-market, generally capturing IV at or close to its peak.

This popular screen will give you a list of stocks whose Options premiums tend to rise into Earnings. It includes only those stocks whose Earnings are at least two weeks away from today.

Screen criteria:

  1. Earnings Date Start Date : Current Date + 15 Days
  2. Earnings Date End Date : Current Date + 30 Days
  3. Predicted Move (Next Day) Min : 5%
  4. Options Type: Weekly or Monthly if that lines up with the two to three-week lead-time for entering the trade

Strategy Guideline:

  1. Buy a Straddle at or close to the money two to three weeks pre-EA.
  2. Sell the position either the night before the EA when the company announces earnings pre-market, or during the EA day when it announces post-market.
  3. Expiration date should generally be the closest expiry immediately after the EA.
  4. Straddle price should not be more 60% of predicted move.

Predicted Move (Volatility)

Similar to Implied Volatility in Options. Expected volatility % based on our Proprietary Volatility Predication Model. We are expecting that stock price will likely to reach % in either direction by the end of next trading session after Earnings are released and not necessarily the closing volatility %.

Why is it important?

    This indicator helps

  1. Knowing expected volatility in stocks after Earnings helps to decide trading stocks before Earnings Announcement.
  2. Taking Advantage of volatility collapse following Earnings Results by using Advance Options strategies such as Spread and Straddles.

Since Last Earnings

Change in share price since last Earnings release.

Why is it Important?

When share has gained more than 10% since it's last Earning release, it tends to over react to minor bad news and give up some gains if not all. So, it contains more downside volatility than upside When share has dropped more than 10% since it's last Earning release, it tends to over react to minor good news and recover some drops if not all. So, it contains more upside volatility than downside.

EPS Surprise (%)

Occurs when a company's reported quarterly or annual profits are above or below analysts' expectations. Here is the formula to derive % EPS Surprice:

Actual EPS - Estimated EPS
------------------------------------- x 100
Estimated EPS

Why is it Important?

Earnings surprises can have a huge impact on a company's stock price. Several studies suggest that positive earnings surprises not only lead to an immediate hike in a stock's price, but also to a gradual increase over time. Hence, it's not surprising that some companies are known for routinely beating earning projections. A negative earnings surprise will usually result in a decline in share price.

Next Day Price Change (%)

Next Regular trading session Closing price following Earnings result.

For After Market Close Earnings, It is a next trading day closing price. For Before Market Open Earnings, It is the same trading day closing price.

Why is it Important?

Next Day price change is a reaction of Earnings result.

Global Bond Watch: The Bond Market Is Repricing the Cost of Growth

Posted on Sep 18, 2026 by Grayson Cavern

Global Bond Watch: The Bond Market Is Repricing the Cost of Growth

The bond market just put a new price tag on money. The U.S. 10-year Treasury briefly hit 5.041% this week, its highest level since 2007, while Germany’s 10-year Bund reached 3.572%, Japan’s 10-year government bond hit 3.036%, and Britain’s long-end yields also pushed to multi-year highs.

That is a pretty big move in the benchmark that sits underneath everything from mortgages to corporate bonds. Goldman Sachs says the pressure is coming from a nasty combination of swollen government borrowing, AI-related corporate debt issuance, resilient growth and the energy shock. Governments and companies funding AI infrastructure are increasingly reaching into the same pool of global savings. And that’s the part I’m watching. The bond selloff is changing the hurdle rate for growth.
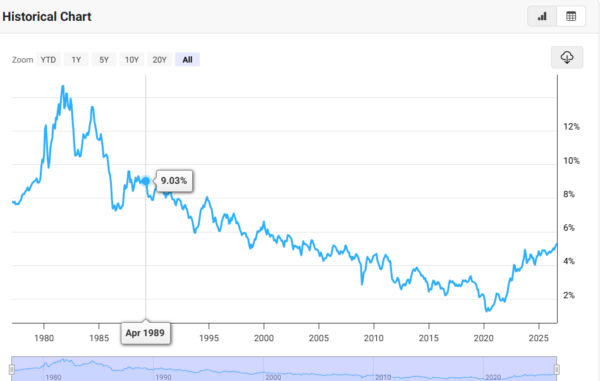
bond - StockEarnings
Source: MacroTrends

The AI Boom Has Created A Second Borrower Competing With Governments


AI infrastructure has become one of the biggest capital-spending races on the planet, and now the companies building it are showing up in the debt market at the same time governments are issuing enormous amounts of paper.

Goldman estimates nearly $500 billion of AI-related debt issuance in 2026, with hyperscalers accounting for roughly 40% of that total. Oracle (NYSE: ORCL) gives us a clean look at what this means in practice. The company said it expected to spend roughly $70 billion on AI data centers in its current fiscal year and planned to raise another $40 billion through debt and equity. Oracle shares dropped 8.9% after investors got a look at the financing requirements. 

Microsoft (NASDAQ: MSFT) and Amazon (NASDAQ: AMZN) are also spending at extraordinary rates on data centers and AI infrastructure, with the major hyperscalers collectively pushing hundreds of billions of dollars into capex. Reuters reported that the five biggest hyperscalers could see capital spending exceed free cash flow by 2027.  If the cost of financing rises, every one of those projects needs to clear a higher return hurdle. That is where the bond market starts showing up in the equity story.

Higher Yields Are Now Reaching The Real Economy

You don’t have to own a bond to feel the repricing.

Look at housing. The average U.S. 30-year fixed mortgage rate jumped 19 basis points in one week to 6.95%, its highest level since January 2025. 

That’s the transmission mechanism in plain English – Treasury yields move, mortgage financing gets more expensive, and suddenly the same house requires a much bigger monthly payment. This is why companies like D.R. Horton (NYSE: DHI) is getting caught in the crosshairs. The homebuilder doesn’t need a housing crash for higher yields to hurt. A buyer can simply get priced out, demand can slow, incentives can rise, and projects that looked attractive under cheaper financing can become harder to justify.

The same math applies to warehouses, factories, data centers and other capital-heavy projects. Prologis (NYSE: PLD) is a useful example because even a company with strong real estate demand still has to refinance and fund an enormous asset base. These examples help us understand that higher yields don’t need to blow up the economy before investors start caring about their portfolios’ health. They only need to make the marginal project less attractive, just as we have it now.

The Market Hasn’t Reached The Scary Part Yet

Now the difference between this setup and the traditional credit scare is that credit spreads haven’t blown out. And the market isn’t panicking yet.

Goldman says the biggest tech companies have issued more than $170 billion of debt this year, while credit spreads remain near historical highs and credit volatility sits near record lows. Investors are still focused heavily on the attractive all-in yield rather than treating these borrowers as imminent credit problems. That’s actually more useful to watch.

The bond market is repricing the cost of funding before it has repriced the quality of the borrowers. And JPMorgan Chase & Co. (NYSE: JPM) is sitting right in the middle of that flow. Corporate borrowing, refinancing, underwriting and credit demand all run through the banking system, making JPM a useful name to watch as the cost of capital moves higher. The bank is also expanding its fixed-income footprint with a frontier-market local-currency bond index covering nearly $330 billion of debt across 26 countries. If companies can still borrow, the game continues. They just have to make the numbers work harder.

Watch The Cost Of Capital, Not Just The Yield

This is why I wouldn’t get hung up on whether the 10-year closes above or below 5% on any given day. The bigger signal is whether long-term yields stay elevated while the economy keeps demanding enormous amounts of capital.

I’m watching three things from here: the 10-year and 30-year Treasury yields, corporate credit spreads, and whether AI and infrastructure spending keep accelerating at a pace that can justify the financing bill.

If yields stay high but spreads remain tight, companies can keep borrowing. If yields stay high and spreads start widening, the financing squeeze gets much more serious. And if AI spending keeps climbing while free cash flow doesn’t keep pace, investors eventually have to put a higher price on the capital required to produce that growth.

That’s where the bond market can start rewriting the equity story, and by extension, millions of portfolios around the world.


Join over 1.2M+ investors/traders who receive daily and weekly notable earnings alerts with predicted move