ajax loader

Loading...


Ride-the-Wave Strategy – Best for Stock Traders

Ride-the-Wave targets multi-day price momentum following a company’s earnings announcement (EA). With this strategy:

  1. Buy a stock one day post-EA if a stock reacts positively post-earnings:
    1. Near the close of trading the EA-day for a pre-market-EA
    2. Near the close of the following day for a post-market-EA
  2. Sell-to-close after 7-10 days, or possibly earlier if a desired price target is reached

Similarly,

  1. short a stock one day post-EA if a stock reacts negatively post-earnings:
    1. near the close of trading the EA-day for a premarket-EA
    2. near the close of the following day for a post-market-EA
  2. then buy-to-close after 7-10 days, or possibly earlier if a desired price target is reached

Important: Ride-the-Wave is predicated on significant price momentum triggered by an EA. The 7-10 day scenario is the maximum trade hold-time. If you see post EA-momentum is halted or reversed by a significant opposite move, re-evaluate your presence in the trade.

This popular StockEarnings screen below will give you a list of stocks that historically exhibit significant price momentum following an EA for the next seven days:

  1. Stocks exhibiting positive post-EA price moves are buy-candidates
  2. Stocks exhibiting negative post-EA price moves are sell/short-candidates

The screen includes those stocks whose Earnings just came out in last two days.

Screen criteria:

  1. Earnings Date Start Date : Current Date + -1 Day
  2. Earnings Date End Date : Current Date + -2 Days
  3. Predicted Move (Next Day) Max : 7%
  4. Predicted Move (On 7th Day) Min : 7%

Strategy Guideline:

  1. Buy the stock if stock has reacted positively. Short the stock if stock has reacted negatively (see above).
  2. Close the position in 7-10 days, or possibly earlier based on price move.

Volatility Crush Strategy - Best for Options Traders

The Volatility Crush strategy is used with stocks that typically experience relatively low-to-moderate price moves (≤4%) following their Earnings Announcements (EA). The basic trade idea is to sell put or call options right before the EA, collecting a credit when options premium is very high due to elevated implied volatility (IV). You then close the position right after the EA by buying the option back much cheaper due to the significant drop in IV that occurs after the mystery of the EA disappears. In assessing this trade, you need to do your homework to ensure you collect sufficient premium to make the trade worthwhile.

This trade is practical due to the low-to-moderate price-move after the EA, which generally won’t significantly affect the options price, unlike an “action” stock, which experience great price moves post-EA. With these symbols, if you’re on the right side of the price move, that’s a great thing. But if you’re on the wrong side of the move, not so great. Consequently, by minimizing the effect of the post-EA price move, you have a much better chance to profit from the reduction in IV without it being ruined by a violent price move.

For this trade, open the position either (1) the night before the EA when the company announces earnings or (2) during the EA day when it announces post-market, generally capturing IV at or close to its peak.

For this trade, open the position either (1) the night before the EA when the company announces earnings or (2) during the EA day when it announces post-market, generally capturing IV at or close to its peak.

This popular stockearnings screen will give you a list of stocks which do not react more than 4% fpost-EA. It includes only those stocks whose earnings are releasing next day.

Screen criteria:

  1. Earnings Date Start Date : Current Date + 1
  2. Earnings Date End Date : Current Date + 1
  3. Predicted Move (Next Day) Max : 4%
  4. Options Type: Weekly

Strategy Guideline:

  1. Options Strategy: Sell Call and Put
  2. Options Strike Price: Current Stock Price – (% Predicated Move x 2)
  3. Expiration Date: It should generally be the closest expiry immediately after the EA.
  4. Buy Insurance: Buying back Call and Put at Strike price which 10% lower than Sell Strike Price is optional but recommended.

Watch Video for More Detail

Volatility Rush Strategy - Best for Options Traders

The Volatility Rush takes advantage of increasing options premiums into earnings announcements (EA) caused by an anticipated rise in Implied Volatility (IV). With this strategy, Buy a Call and Put at-the-money (a long straddle) 2-3 weeks before the EA when IV is lower. Sell the position either (1) the night before the EA when the company announces earnings pre-market, or (2) during the EA day when it announces post-market, generally capturing IV at or close to its peak.

This popular screen will give you a list of stocks whose Options premiums tend to rise into Earnings. It includes only those stocks whose Earnings are at least two weeks away from today.

Screen criteria:

  1. Earnings Date Start Date : Current Date + 15 Days
  2. Earnings Date End Date : Current Date + 30 Days
  3. Predicted Move (Next Day) Min : 5%
  4. Options Type: Weekly or Monthly if that lines up with the two to three-week lead-time for entering the trade

Strategy Guideline:

  1. Buy a Straddle at or close to the money two to three weeks pre-EA.
  2. Sell the position either the night before the EA when the company announces earnings pre-market, or during the EA day when it announces post-market.
  3. Expiration date should generally be the closest expiry immediately after the EA.
  4. Straddle price should not be more 60% of predicted move.

Predicted Move (Volatility)

Similar to Implied Volatility in Options. Expected volatility % based on our Proprietary Volatility Predication Model. We are expecting that stock price will likely to reach % in either direction by the end of next trading session after Earnings are released and not necessarily the closing volatility %.

Why is it important?

    This indicator helps

  1. Knowing expected volatility in stocks after Earnings helps to decide trading stocks before Earnings Announcement.
  2. Taking Advantage of volatility collapse following Earnings Results by using Advance Options strategies such as Spread and Straddles.

Since Last Earnings

Change in share price since last Earnings release.

Why is it Important?

When share has gained more than 10% since it's last Earning release, it tends to over react to minor bad news and give up some gains if not all. So, it contains more downside volatility than upside When share has dropped more than 10% since it's last Earning release, it tends to over react to minor good news and recover some drops if not all. So, it contains more upside volatility than downside.

EPS Surprise (%)

Occurs when a company's reported quarterly or annual profits are above or below analysts' expectations. Here is the formula to derive % EPS Surprice:

Actual EPS - Estimated EPS
------------------------------------- x 100
Estimated EPS

Why is it Important?

Earnings surprises can have a huge impact on a company's stock price. Several studies suggest that positive earnings surprises not only lead to an immediate hike in a stock's price, but also to a gradual increase over time. Hence, it's not surprising that some companies are known for routinely beating earning projections. A negative earnings surprise will usually result in a decline in share price.

Next Day Price Change (%)

Next Regular trading session Closing price following Earnings result.

For After Market Close Earnings, It is a next trading day closing price. For Before Market Open Earnings, It is the same trading day closing price.

Why is it Important?

Next Day price change is a reaction of Earnings result.

BUD Stock: Why Deutsche Bank Sees a Stronger Road Ahead

Posted on Sep 18, 2026 by Chris Markoch

BUD Stock: Why Deutsche Bank Sees a Stronger Road Ahead

Consumer discretionary stocks are getting bludgeoned by inflation fears and a fresh interest rate hike. Under that backdrop, it’s worth noting that Deutsche Bank recently upgraded Anheuser-Busch (NYSE: BUD) from a Hold to a Buy and assigned a $91 price target.  

For perspective, the $91 price target is in line with the consensus price target nearly to the penny ($91.08), That would give investors an upside of around 15% to go along with a dividend that yields 1.79% as of the market close on Sept. 17. 

However, BUD stock is up more than 22% in 2026. So, having a leading analyst forecast further growth for Anheuser-Busch may get investors off the sidelines.  

Before you decide whether to invest in the company with the iconic brand known as The King of Beers, it’s important to understand both sides of the alcoholic beverage market. The threats are real, but so are the opportunities. 

America is Becoming a Drier Country 


A data point that was hard to ignore in the last several rounds of corporate earnings was bearish for alcohol stocks. American consumers are drinking less. Not just a little less…a lot.  

The numbers back that up. In Anheuser-Busch’s own Q2 2026 earnings report, released July 30, U.S. volumes fell 0.7% even as the industry’s top brands, Michelob Ultra and Busch Light among them, continued to gain share. The company only grew U.S. revenue at all (up 2.6%) because it pushed pricing and mix harder, not because more people were buying beer. 

That’s particularly true of the coveted Gen-Z demographic. They’re on the wellness train and opting for social activities that don’t revolve around alcohol.  

Two or three quarters may still be an anomaly, but it doesn’t feel like it. There’s something going on, and it’s not likely to change soon.  

America Isn’t Where Anheuser-Busch Makes Its Money 

Here’s the piece of the puzzle Deutsche Bank analyst Mitch Collett is leaning on. Anheuser-Busch barely looks like an American beer stock once you check where the growth is actually coming from.  

According to the company’s own 2Q26 segment breakdown, Middle Americas (Mexico, Colombia, and the rest of the region) accounted for 41% of EBITDA and grew organic EBITDA 10.3%. South America added another 18% of EBITDA, up 14.3%. Combined, those two emerging-market zones represent nearly 60% of the company’s profit base, and both are compounding at double-digit rates. 

Contrast that with North America, which contributed 20% of EBITDA but grew organic EBITDA by just 0.5%, and Asia Pacific, where EBITDA fell 10.9% on a 4.7% volume decline in China. The pattern is consistent: developed markets are flat to shrinking, and developing markets are carrying the company. 

That split matters because the “Americans are drinking less” narrative, however real, is a developed-market story. A 2025 Gallup poll found that just 54% of U.S. adults drink alcohol at all, the lowest reading in 90 years. Collett’s argument is that Anheuser-Busch’s dominant share across its core emerging markets acts as a kind of structural insulation. Mexico alone posted 9.8% revenue growth and 50.3% EBITDA margins in the quarter, the kind of numbers no developed beer market comes close to matching right now. 

Collett called Anheuser-Busch one of the most emerging-markets-focused names in European staples. That’s a notable distinction in a sector where most large beverage names still draw the bulk of their profit from slowing developed economies. 

On the domestic side, Collett points to Beyond Beer, Anheuser-Busch’s lineup of cocktails and sparkling beverages, as a second growth lever. It’s not a small bet anymore: Beyond Beer revenue grew 44% company-wide in the quarter, led in the U.S. by Cutwater, which the company says was the #1 share-gaining brand in the entire spirits industry.  

No-alcohol beer, led by Michelob Ultra Zero, grew revenue more than 100% and continues to outpace the broader no-alcohol category. Those are the two categories built for a consumer who wants something in hand at a social occasion, just not necessarily a Bud Light. 

Wall Street, broadly, agrees with the upgrade. Of the 12 analysts covering the stock, 11 rate it Buy or Strong Buy, with just one Hold remaining. That’s about as close to consensus as a sell-side call gets. 

BUD Stands Out Among Its Peers 

Another way to understand the Deutsche Bank rating is to look at the performance of BUD relative to peers such as Molson Coors (NYSE: TAP) and The Boston Beer Co. (NYSE: SAM)

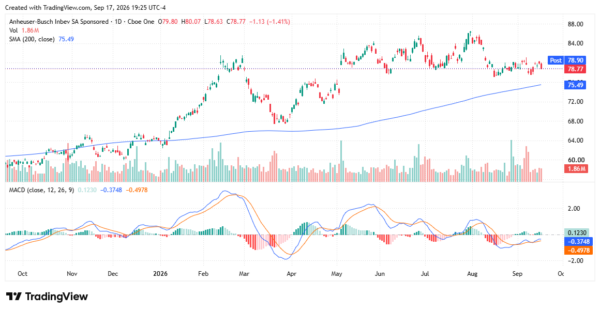
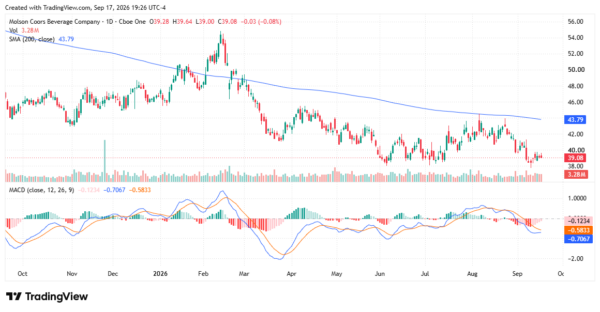
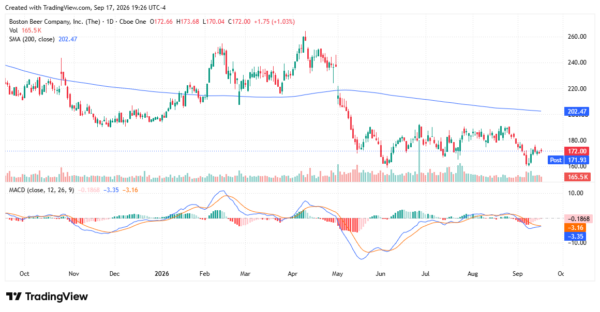
BUD stock is up 22.9% year-to-date as of the market close on Sept. 17. By contrast, TAP stock is down 16.4%, and SAM stock is down 11.3%. Both stocks are down over the last 12 months, in contrast to BUD, which is up 33.9% over the same period.  
bud - StockEarnings

In this case, there may be a story behind that move. Investors may remember that Anheuser-Busch was identified as part of a boycott after it aired a social media promotion featuring transgender influencer Dylan Mulvaney. BUD stock fell sharply, which at the time was seen as overdone.  
bud - StockEarnings

The point is, some of this gain may be a catch-up trade. But it’s unlikely to believe that it explains all of it.  
bud - StockEarnings

The Balance Sheet Backs Up the Growth Story 

One more thing worth noting: this isn’t growth funded by leverage. Anheuser-Busch’s net leverage ratio fell to 2.86x as of June 2026, down from 3.27x a year earlier and more than a full turn better than four years ago.  

Free cash flow jumped $2.5 billion year-over-year to $3.9 billion for the first half of 2026, and underlying earnings per share grew 23.4% in the quarter. A brewer with improving cash generation and a shrinking debt load has more room to keep investing in Beyond Beer and emerging-market share gains, even if U.S. volumes stay soft. 

Why This Upgrade Should Matter to Your Portfolio 

None of this erases the real headwinds facing the alcohol sector. Gen Z’s retreat from drinking is a genuine structural shift, not a temporary blip, and it will keep showing up in developed-market volume numbers for years, as Anheuser-Busch’s own U.S. results just confirmed.  

But Deutsche Bank’s upgrade is a reminder that a stock’s exposure to a bearish narrative isn’t the same as its exposure to the underlying numbers. With nearly 60% of profit coming from emerging markets growing double digits, and a balance sheet in its best shape in years, the gap between perception and fundamentals may be the whole investment case for BUD. 

A former marketing copywriter turned freelance financial writer and market analyst. I have a passion for delivering insights to investors. I write regularly about stocks for StockEarnings and MarketBeat. Posts are not advice.

Join over 1.2M+ investors/traders who receive daily and weekly notable earnings alerts with predicted move
