ajax loader

Loading...


Ride-the-Wave Strategy – Best for Stock Traders

Ride-the-Wave targets multi-day price momentum following a company’s earnings announcement (EA). With this strategy:

  1. Buy a stock one day post-EA if a stock reacts positively post-earnings:
    1. Near the close of trading the EA-day for a pre-market-EA
    2. Near the close of the following day for a post-market-EA
  2. Sell-to-close after 7-10 days, or possibly earlier if a desired price target is reached

Similarly,

  1. short a stock one day post-EA if a stock reacts negatively post-earnings:
    1. near the close of trading the EA-day for a premarket-EA
    2. near the close of the following day for a post-market-EA
  2. then buy-to-close after 7-10 days, or possibly earlier if a desired price target is reached

Important: Ride-the-Wave is predicated on significant price momentum triggered by an EA. The 7-10 day scenario is the maximum trade hold-time. If you see post EA-momentum is halted or reversed by a significant opposite move, re-evaluate your presence in the trade.

This popular StockEarnings screen below will give you a list of stocks that historically exhibit significant price momentum following an EA for the next seven days:

  1. Stocks exhibiting positive post-EA price moves are buy-candidates
  2. Stocks exhibiting negative post-EA price moves are sell/short-candidates

The screen includes those stocks whose Earnings just came out in last two days.

Screen criteria:

  1. Earnings Date Start Date : Current Date + -1 Day
  2. Earnings Date End Date : Current Date + -2 Days
  3. Predicted Move (Next Day) Max : 7%
  4. Predicted Move (On 7th Day) Min : 7%

Strategy Guideline:

  1. Buy the stock if stock has reacted positively. Short the stock if stock has reacted negatively (see above).
  2. Close the position in 7-10 days, or possibly earlier based on price move.

Volatility Crush Strategy - Best for Options Traders

The Volatility Crush strategy is used with stocks that typically experience relatively low-to-moderate price moves (≤4%) following their Earnings Announcements (EA). The basic trade idea is to sell put or call options right before the EA, collecting a credit when options premium is very high due to elevated implied volatility (IV). You then close the position right after the EA by buying the option back much cheaper due to the significant drop in IV that occurs after the mystery of the EA disappears. In assessing this trade, you need to do your homework to ensure you collect sufficient premium to make the trade worthwhile.

This trade is practical due to the low-to-moderate price-move after the EA, which generally won’t significantly affect the options price, unlike an “action” stock, which experience great price moves post-EA. With these symbols, if you’re on the right side of the price move, that’s a great thing. But if you’re on the wrong side of the move, not so great. Consequently, by minimizing the effect of the post-EA price move, you have a much better chance to profit from the reduction in IV without it being ruined by a violent price move.

For this trade, open the position either (1) the night before the EA when the company announces earnings or (2) during the EA day when it announces post-market, generally capturing IV at or close to its peak.

For this trade, open the position either (1) the night before the EA when the company announces earnings or (2) during the EA day when it announces post-market, generally capturing IV at or close to its peak.

This popular stockearnings screen will give you a list of stocks which do not react more than 4% fpost-EA. It includes only those stocks whose earnings are releasing next day.

Screen criteria:

  1. Earnings Date Start Date : Current Date + 1
  2. Earnings Date End Date : Current Date + 1
  3. Predicted Move (Next Day) Max : 4%
  4. Options Type: Weekly

Strategy Guideline:

  1. Options Strategy: Sell Call and Put
  2. Options Strike Price: Current Stock Price – (% Predicated Move x 2)
  3. Expiration Date: It should generally be the closest expiry immediately after the EA.
  4. Buy Insurance: Buying back Call and Put at Strike price which 10% lower than Sell Strike Price is optional but recommended.

Watch Video for More Detail

Volatility Rush Strategy - Best for Options Traders

The Volatility Rush takes advantage of increasing options premiums into earnings announcements (EA) caused by an anticipated rise in Implied Volatility (IV). With this strategy, Buy a Call and Put at-the-money (a long straddle) 2-3 weeks before the EA when IV is lower. Sell the position either (1) the night before the EA when the company announces earnings pre-market, or (2) during the EA day when it announces post-market, generally capturing IV at or close to its peak.

This popular screen will give you a list of stocks whose Options premiums tend to rise into Earnings. It includes only those stocks whose Earnings are at least two weeks away from today.

Screen criteria:

  1. Earnings Date Start Date : Current Date + 15 Days
  2. Earnings Date End Date : Current Date + 30 Days
  3. Predicted Move (Next Day) Min : 5%
  4. Options Type: Weekly or Monthly if that lines up with the two to three-week lead-time for entering the trade

Strategy Guideline:

  1. Buy a Straddle at or close to the money two to three weeks pre-EA.
  2. Sell the position either the night before the EA when the company announces earnings pre-market, or during the EA day when it announces post-market.
  3. Expiration date should generally be the closest expiry immediately after the EA.
  4. Straddle price should not be more 60% of predicted move.

Predicted Move (Volatility)

Similar to Implied Volatility in Options. Expected volatility % based on our Proprietary Volatility Predication Model. We are expecting that stock price will likely to reach % in either direction by the end of next trading session after Earnings are released and not necessarily the closing volatility %.

Why is it important?

    This indicator helps

  1. Knowing expected volatility in stocks after Earnings helps to decide trading stocks before Earnings Announcement.
  2. Taking Advantage of volatility collapse following Earnings Results by using Advance Options strategies such as Spread and Straddles.

Since Last Earnings

Change in share price since last Earnings release.

Why is it Important?

When share has gained more than 10% since it's last Earning release, it tends to over react to minor bad news and give up some gains if not all. So, it contains more downside volatility than upside When share has dropped more than 10% since it's last Earning release, it tends to over react to minor good news and recover some drops if not all. So, it contains more upside volatility than downside.

EPS Surprise (%)

Occurs when a company's reported quarterly or annual profits are above or below analysts' expectations. Here is the formula to derive % EPS Surprice:

Actual EPS - Estimated EPS
------------------------------------- x 100
Estimated EPS

Why is it Important?

Earnings surprises can have a huge impact on a company's stock price. Several studies suggest that positive earnings surprises not only lead to an immediate hike in a stock's price, but also to a gradual increase over time. Hence, it's not surprising that some companies are known for routinely beating earning projections. A negative earnings surprise will usually result in a decline in share price.

Next Day Price Change (%)

Next Regular trading session Closing price following Earnings result.

For After Market Close Earnings, It is a next trading day closing price. For Before Market Open Earnings, It is the same trading day closing price.

Why is it Important?

Next Day price change is a reaction of Earnings result.

Viking’s Ocean Boom Is Starting To Expose The Cost Of Its Fleet Expansion

Posted on Nov 18, 2026 by Grayson Cavern

Viking’s Ocean Boom Is Starting To Expose The Cost Of Its Fleet Expansion

Viking Holdings (NYSE: VIK) is finding its strongest growth engine in Ocean, but Q3 earnings exposed the strain elsewhere in the business. Revenue climbed 9.2% to $2.18 billion, while Adjusted EBITDA fell 4.3% to $673.5 million and adjusted EPS slipped from $1.20 to $1.11. Viking’s capacity passenger cruise days increased 10.2% year over year, but actual passenger cruise days advanced just 4.9%, leaving a widening gap between available berths and occupied capacity.

The figures point to a growing divide inside Viking. Ocean is delivering stronger margins and booking growth, while River struggles with disrupted itineraries and an expanding cost base. Meanwhile, the company is committing billions to new ships that must eventually justify the investment.

River Fleet Is Struggling To Fill The Extra Berths


Viking added capacity passenger cruise days 10.2% year over year, but actual passenger cruise days advanced just 4.9%, leaving a widening gap between available berths and occupied capacity. Occupancy consequently fell to 91.3%, weakening the contribution Viking gets from its expanding River fleet.

Low water levels across Europe compounded that problem, forcing Viking to modify itineraries and accommodate guests through a difficult operating season. Although every scheduled cruise operated, disruptions and cancellations cost the company an estimated $100 million in third-quarter revenue and approximately $100 million in Adjusted Gross Margin impact.

By mid-November, roughly 70% of River capacity passenger cruise days had been affected, and 20% of guests booked on those itineraries had cancelled. Management had yet to quantify the full Q4 impact.

Vessel operating expenses then climbed 17.6% to $461.4 million, while expenses per capacity passenger cruise day increased from $174 to $186. Viking is spending more to operate a larger fleet while disruptions make those additional berths harder to monetize… leaving River with less room to absorb further operating pressure.

Ocean Is Pulling Viking’s Earnings Away From The River

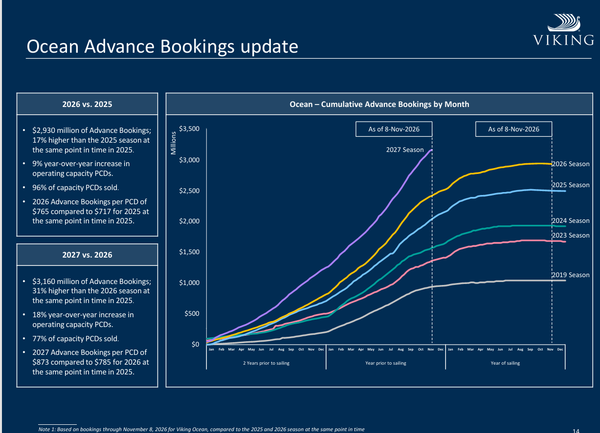
Ocean has become the stronger contributor to Viking Holdings’ earnings, generating $1.75 billion in Adjusted Gross Margin during the first nine months of 2026, up 16.6% year over year. River produced $1.40 billion, growing just 1.9%. The difference is widening, and the operating figures show why.

Ocean filled 96% of capacity and generated net yield of $624, up 5.5%. River’s net yield reached $599, increasing just 1.6%, while occupancy lagged Ocean by nearly five percentage points. Ocean is filling more of its ships and extracting more revenue from every passenger cruise day.

Management expects Ocean to account for approximately 70% of new-build capacity through 2036, directing expansion toward the segment with stronger occupancy, higher yields, and faster margin growth. I agree with that strategy, but the returns on future ships remain to be proven. Each new vessel brings operating expenses, depreciation and financing demands, and Ocean must preserve its pricing power as capacity expands.
viking - StockEarnings

Viking Is Paying Guests To Come Back, And River Will Feel It

Viking’s voucher program complicates the picture behind River’s forward bookings, with $165 million in cancellation vouchers issued to guests who abandoned disrupted sailings and approximately $265 million in goodwill vouchers issued to those who completed their journeys. Around 60% of the cancellation vouchers had been rebooked by November 8.

Approximately half of the goodwill vouchers had also been redeemed, with 60% of those redemptions going toward 2027 sailings. Viking includes these redemptions in advance bookings at net value, so the headline figures do not represent entirely fresh, full-price demand.

The program helps retain customers, but voucher use also reduces the value recognized when those guests return. River’s 2027 advance bookings stood at approximately $2.2 billion, broadly flat against the comparable period despite expected capacity growth of 13%. Ocean had secured approximately $3.2 billion, up 31%, against expected capacity growth of 18%. Ocean is growing booking value faster than its capacity, while River is preparing to bring more berths to market without comparable demand momentum.

River needs stronger demand from guests willing to pay for the experience. Repeat bookings protect customer relationships, but they do not erase the gap between capacity growth and booking performance.

The Fleet Expansion Is Eating Into Viking’s Cash Cushion

Viking generated $1.72 billion in operating cash flow during the first nine months, essentially matching the prior year, but investment in property, plant, equipment and intangible assets jumped to $1.32 billion from $869 million. After those investments, approximately $401 million remained, compared with roughly $854 million a year earlier.

The expansion program is consuming a much larger share of the cash generated by operations. Viking still has financial flexibility, with $4.1 billion in cash, $2.3 billion in net debt, and net leverage of 1.2 times at September 30. However, the $350 million spent on share repurchases during Q3 deserves scrutiny alongside the growing fleet commitments.

I would rather see Viking demonstrate stronger cash conversion from its expanding fleet before accelerating shareholder returns. The balance sheet can support the investment, but the ships must deliver earnings that justify the capital committed to them.

VIK Has Reclaimed Its Moving Averages, But $100 Stands In The Way

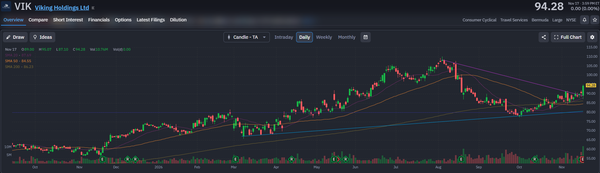
VIK stock closed at $94.28, above its 20-day moving average of $87.69, 50-day average of $84.55, and 200-day average of $86.23.. The recovery from October’s low near $78 has restored the short-term uptrend, although shares now face resistance between $95 and $100. A decisive move above $100 could open a path toward $105 to $108, near the descending trendline from August’s peak. Rejection at resistance could pull shares toward $90, with the moving-average cluster between $85 and $88 offering the next support zone.

I’m adding to my position here, but I want stronger cash generation before assigning the stock a richer multiple. As said, Ocean gives Viking a compelling growth engine, while River’s booking weakness and the rising cost of expansion leave plenty for management to prove.
viking - StockEarnings

Join over 1.2M+ investors/traders who receive daily and weekly notable earnings alerts with predicted move