ajax loader

Loading...


Ride-the-Wave Strategy – Best for Stock Traders

Ride-the-Wave targets multi-day price momentum following a company’s earnings announcement (EA). With this strategy:

  1. Buy a stock one day post-EA if a stock reacts positively post-earnings:
    1. Near the close of trading the EA-day for a pre-market-EA
    2. Near the close of the following day for a post-market-EA
  2. Sell-to-close after 7-10 days, or possibly earlier if a desired price target is reached

Similarly,

  1. short a stock one day post-EA if a stock reacts negatively post-earnings:
    1. near the close of trading the EA-day for a premarket-EA
    2. near the close of the following day for a post-market-EA
  2. then buy-to-close after 7-10 days, or possibly earlier if a desired price target is reached

Important: Ride-the-Wave is predicated on significant price momentum triggered by an EA. The 7-10 day scenario is the maximum trade hold-time. If you see post EA-momentum is halted or reversed by a significant opposite move, re-evaluate your presence in the trade.

This popular StockEarnings screen below will give you a list of stocks that historically exhibit significant price momentum following an EA for the next seven days:

  1. Stocks exhibiting positive post-EA price moves are buy-candidates
  2. Stocks exhibiting negative post-EA price moves are sell/short-candidates

The screen includes those stocks whose Earnings just came out in last two days.

Screen criteria:

  1. Earnings Date Start Date : Current Date + -1 Day
  2. Earnings Date End Date : Current Date + -2 Days
  3. Predicted Move (Next Day) Max : 7%
  4. Predicted Move (On 7th Day) Min : 7%

Strategy Guideline:

  1. Buy the stock if stock has reacted positively. Short the stock if stock has reacted negatively (see above).
  2. Close the position in 7-10 days, or possibly earlier based on price move.

Volatility Crush Strategy - Best for Options Traders

The Volatility Crush strategy is used with stocks that typically experience relatively low-to-moderate price moves (≤4%) following their Earnings Announcements (EA). The basic trade idea is to sell put or call options right before the EA, collecting a credit when options premium is very high due to elevated implied volatility (IV). You then close the position right after the EA by buying the option back much cheaper due to the significant drop in IV that occurs after the mystery of the EA disappears. In assessing this trade, you need to do your homework to ensure you collect sufficient premium to make the trade worthwhile.

This trade is practical due to the low-to-moderate price-move after the EA, which generally won’t significantly affect the options price, unlike an “action” stock, which experience great price moves post-EA. With these symbols, if you’re on the right side of the price move, that’s a great thing. But if you’re on the wrong side of the move, not so great. Consequently, by minimizing the effect of the post-EA price move, you have a much better chance to profit from the reduction in IV without it being ruined by a violent price move.

For this trade, open the position either (1) the night before the EA when the company announces earnings or (2) during the EA day when it announces post-market, generally capturing IV at or close to its peak.

For this trade, open the position either (1) the night before the EA when the company announces earnings or (2) during the EA day when it announces post-market, generally capturing IV at or close to its peak.

This popular stockearnings screen will give you a list of stocks which do not react more than 4% fpost-EA. It includes only those stocks whose earnings are releasing next day.

Screen criteria:

  1. Earnings Date Start Date : Current Date + 1
  2. Earnings Date End Date : Current Date + 1
  3. Predicted Move (Next Day) Max : 4%
  4. Options Type: Weekly

Strategy Guideline:

  1. Options Strategy: Sell Call and Put
  2. Options Strike Price: Current Stock Price – (% Predicated Move x 2)
  3. Expiration Date: It should generally be the closest expiry immediately after the EA.
  4. Buy Insurance: Buying back Call and Put at Strike price which 10% lower than Sell Strike Price is optional but recommended.

Watch Video for More Detail

Volatility Rush Strategy - Best for Options Traders

The Volatility Rush takes advantage of increasing options premiums into earnings announcements (EA) caused by an anticipated rise in Implied Volatility (IV). With this strategy, Buy a Call and Put at-the-money (a long straddle) 2-3 weeks before the EA when IV is lower. Sell the position either (1) the night before the EA when the company announces earnings pre-market, or (2) during the EA day when it announces post-market, generally capturing IV at or close to its peak.

This popular screen will give you a list of stocks whose Options premiums tend to rise into Earnings. It includes only those stocks whose Earnings are at least two weeks away from today.

Screen criteria:

  1. Earnings Date Start Date : Current Date + 15 Days
  2. Earnings Date End Date : Current Date + 30 Days
  3. Predicted Move (Next Day) Min : 5%
  4. Options Type: Weekly or Monthly if that lines up with the two to three-week lead-time for entering the trade

Strategy Guideline:

  1. Buy a Straddle at or close to the money two to three weeks pre-EA.
  2. Sell the position either the night before the EA when the company announces earnings pre-market, or during the EA day when it announces post-market.
  3. Expiration date should generally be the closest expiry immediately after the EA.
  4. Straddle price should not be more 60% of predicted move.

Predicted Move (Volatility)

Similar to Implied Volatility in Options. Expected volatility % based on our Proprietary Volatility Predication Model. We are expecting that stock price will likely to reach % in either direction by the end of next trading session after Earnings are released and not necessarily the closing volatility %.

Why is it important?

    This indicator helps

  1. Knowing expected volatility in stocks after Earnings helps to decide trading stocks before Earnings Announcement.
  2. Taking Advantage of volatility collapse following Earnings Results by using Advance Options strategies such as Spread and Straddles.

Since Last Earnings

Change in share price since last Earnings release.

Why is it Important?

When share has gained more than 10% since it's last Earning release, it tends to over react to minor bad news and give up some gains if not all. So, it contains more downside volatility than upside When share has dropped more than 10% since it's last Earning release, it tends to over react to minor good news and recover some drops if not all. So, it contains more upside volatility than downside.

EPS Surprise (%)

Occurs when a company's reported quarterly or annual profits are above or below analysts' expectations. Here is the formula to derive % EPS Surprice:

Actual EPS - Estimated EPS
------------------------------------- x 100
Estimated EPS

Why is it Important?

Earnings surprises can have a huge impact on a company's stock price. Several studies suggest that positive earnings surprises not only lead to an immediate hike in a stock's price, but also to a gradual increase over time. Hence, it's not surprising that some companies are known for routinely beating earning projections. A negative earnings surprise will usually result in a decline in share price.

Next Day Price Change (%)

Next Regular trading session Closing price following Earnings result.

For After Market Close Earnings, It is a next trading day closing price. For Before Market Open Earnings, It is the same trading day closing price.

Why is it Important?

Next Day price change is a reaction of Earnings result.

Three Stocks That May Shoot Off Fireworks After July 4

Posted on Jul 02, 2026 by Chris Markoch

Three Stocks That May Shoot Off Fireworks After July 4

The first half of 2026 told a familiar story. Stock gains stayed concentrated in a handful of mega-cap names, leaving plenty of quality companies overlooked. Heading into the second half, investors should focus on some low-hanging fruit. Three stocks stand out for their combination of strong themes and meaningful upside potential heading into the back half of the year.

NVIDIA (NASDAQ: NVDA) remains the linchpin of the artificial intelligence trade, even after a choppy few months. Cameco (NYSE: CCJ) sits at the center of a uranium and nuclear energy renaissance that shows no signs of slowing. Boston Scientific (NYSE: BSX) just landed a regulatory win that expands its footprint in cardiac care. Each of these stocks has analyst price targets implying upside of at least 50% over the next 12 months, according to consensus estimates.

Investors chasing the same crowded trades often miss what’s building underneath. These three names offer differentiated exposure: AI infrastructure, energy transition, and medical device innovation. None of them requires betting on a single earnings report to work. Each has a multi-year catalyst path.

Below, we break down the setup for these three stocks, including where the charts stand today. This isn’t a call to buy blindly. It’s a case for putting these names on the watchlist as the second half gets underway.

Three Stocks to Watch: A Pause In NVDA Could Set Up the Next Leg Higher


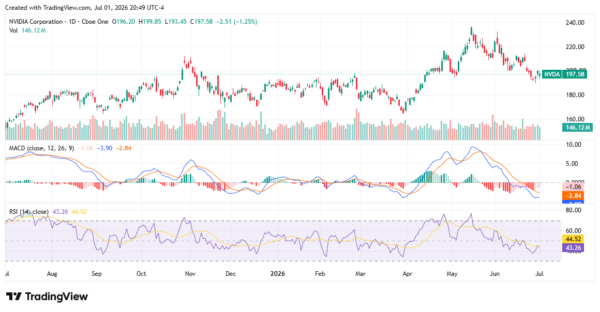
Have NVIDIA investors simply gotten bored? Shares closed at $197.58 on July 1, down 1.25% on the session and roughly 18% off the May peak near $240. The stock has spent June grinding lower in an orderly pullback rather than a panic decline.

The daily chart shows RSI at 43.26, just below its 14-day moving average of 44.52. That’s neutral-to-soft momentum, not oversold. The MACD line sits at -1.06, below its signal line, confirming the recent downtrend in momentum since the May-June rollover. Price is testing the $195-$200 zone, a level that acted as resistance back in October and November before the stock broke out.

A reclaim of that zone on rising volume would signal the pullback is over. A break below the June low near $193 opens the door to a deeper retest. Either way, consensus analyst targets still imply roughly 60% upside from current levels, underscoring how far sentiment has diverged from Wall Street’s underlying growth assumptions for AI compute demand.

three stocks - StockEarnings

Three Stocks to Watch: CCJ’s Uranium Bull Case Gets a Gut Check

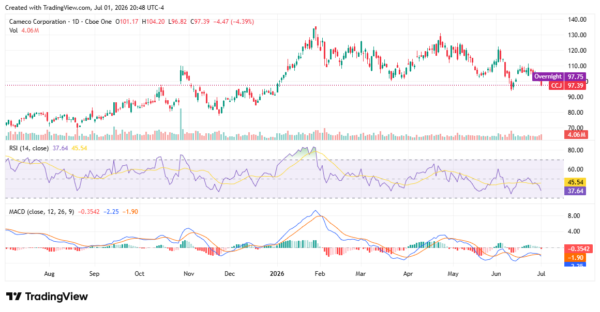
Cameco remains the tip of the spear for the uranium and nuclear energy buildout, but Tuesday’s session was a reminder that the trade isn’t a straight line. Shares dropped 4.39% to $97.39, extending a slide from the February high near $137.

Technicals have turned decisively bearish in the short term. RSI sits at 37.64, below its moving average of 45.54 and approaching oversold territory below 30. The MACD line has fallen to -0.35, with the signal line further negative at -2.25, showing accelerating downside momentum. Volume on the selloff came in above average, a sign of real distribution rather than a thin-market move.

The longer-term structure still matters more than one red day. CCJ remains well above its 2025 base, and the nuclear demand story tied to AI data center power needs hasn’t changed. A stabilization near the $95-$100 support shelf, last tested in June, would be the first sign buyers are stepping back in.

three stocks - StockEarnings

Three Stocks to Watch: BSX Has a Regulatory Win and an Oversold Chart

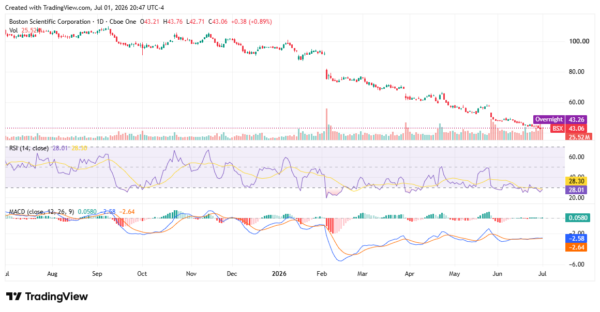
Boston Scientific just received FDA approval to expand the labeling for its FARAPULSE Pulsed Field Ablation System, widening the eligible patient population for one of its fastest-growing product lines. The news lands at an unusual moment technically: shares have been in a steady downtrend for nearly a year, falling from above $100 to the low $40s.

That decline has pushed RSI down to 28.01, solidly in oversold territory below the 30 threshold, with its moving average close behind at 28.30. More interesting is the MACD, where the MACD line has just crossed above zero to 0.058 while the signal line remains negative at -2.58. That crossover is an early signal that downside momentum may be exhausting itself.

Shares closed at $43.06, up 0.89% on the session, with overnight trading near $43.26. Combined with the FARAPULSE label expansion, the technical setup gives BSX a case as a mean-reversion candidate heading into the second half, assuming the broader downtrend confirms a bottom.

three stocks - StockEarnings

Watching for the Bounce

None of these three stocks is a guaranteed winner. NVDA needs to prove the AI trade still has legs beyond the mega-cap names. CCJ needs uranium prices and utility demand to cooperate through a volatile stretch. BSX needs its oversold bounce to hold up against a year-long downtrend.

What ties them together is a gap between price action and underlying fundamentals. Analysts see substantial upside in all three, and each has a catalyst that doesn’t depend on the broader market cooperating. For investors tired of chasing the same handful of names, these three stocks are worth watching as the second half gets underway.

A former marketing copywriter turned freelance financial writer and market analyst. I have a passion for delivering insights to investors. I write regularly about stocks for StockEarnings and MarketBeat. Posts are not advice.

Join over 1.2M+ investors/traders who receive daily and weekly notable earnings alerts with predicted move