ajax loader

Loading...


Ride-the-Wave Strategy – Best for Stock Traders

Ride-the-Wave targets multi-day price momentum following a company’s earnings announcement (EA). With this strategy:

  1. Buy a stock one day post-EA if a stock reacts positively post-earnings:
    1. Near the close of trading the EA-day for a pre-market-EA
    2. Near the close of the following day for a post-market-EA
  2. Sell-to-close after 7-10 days, or possibly earlier if a desired price target is reached

Similarly,

  1. short a stock one day post-EA if a stock reacts negatively post-earnings:
    1. near the close of trading the EA-day for a premarket-EA
    2. near the close of the following day for a post-market-EA
  2. then buy-to-close after 7-10 days, or possibly earlier if a desired price target is reached

Important: Ride-the-Wave is predicated on significant price momentum triggered by an EA. The 7-10 day scenario is the maximum trade hold-time. If you see post EA-momentum is halted or reversed by a significant opposite move, re-evaluate your presence in the trade.

This popular StockEarnings screen below will give you a list of stocks that historically exhibit significant price momentum following an EA for the next seven days:

  1. Stocks exhibiting positive post-EA price moves are buy-candidates
  2. Stocks exhibiting negative post-EA price moves are sell/short-candidates

The screen includes those stocks whose Earnings just came out in last two days.

Screen criteria:

  1. Earnings Date Start Date : Current Date + -1 Day
  2. Earnings Date End Date : Current Date + -2 Days
  3. Predicted Move (Next Day) Max : 7%
  4. Predicted Move (On 7th Day) Min : 7%

Strategy Guideline:

  1. Buy the stock if stock has reacted positively. Short the stock if stock has reacted negatively (see above).
  2. Close the position in 7-10 days, or possibly earlier based on price move.

Volatility Crush Strategy - Best for Options Traders

The Volatility Crush strategy is used with stocks that typically experience relatively low-to-moderate price moves (≤4%) following their Earnings Announcements (EA). The basic trade idea is to sell put or call options right before the EA, collecting a credit when options premium is very high due to elevated implied volatility (IV). You then close the position right after the EA by buying the option back much cheaper due to the significant drop in IV that occurs after the mystery of the EA disappears. In assessing this trade, you need to do your homework to ensure you collect sufficient premium to make the trade worthwhile.

This trade is practical due to the low-to-moderate price-move after the EA, which generally won’t significantly affect the options price, unlike an “action” stock, which experience great price moves post-EA. With these symbols, if you’re on the right side of the price move, that’s a great thing. But if you’re on the wrong side of the move, not so great. Consequently, by minimizing the effect of the post-EA price move, you have a much better chance to profit from the reduction in IV without it being ruined by a violent price move.

For this trade, open the position either (1) the night before the EA when the company announces earnings or (2) during the EA day when it announces post-market, generally capturing IV at or close to its peak.

For this trade, open the position either (1) the night before the EA when the company announces earnings or (2) during the EA day when it announces post-market, generally capturing IV at or close to its peak.

This popular stockearnings screen will give you a list of stocks which do not react more than 4% fpost-EA. It includes only those stocks whose earnings are releasing next day.

Screen criteria:

  1. Earnings Date Start Date : Current Date + 1
  2. Earnings Date End Date : Current Date + 1
  3. Predicted Move (Next Day) Max : 4%
  4. Options Type: Weekly

Strategy Guideline:

  1. Options Strategy: Sell Call and Put
  2. Options Strike Price: Current Stock Price – (% Predicated Move x 2)
  3. Expiration Date: It should generally be the closest expiry immediately after the EA.
  4. Buy Insurance: Buying back Call and Put at Strike price which 10% lower than Sell Strike Price is optional but recommended.

Watch Video for More Detail

Volatility Rush Strategy - Best for Options Traders

The Volatility Rush takes advantage of increasing options premiums into earnings announcements (EA) caused by an anticipated rise in Implied Volatility (IV). With this strategy, Buy a Call and Put at-the-money (a long straddle) 2-3 weeks before the EA when IV is lower. Sell the position either (1) the night before the EA when the company announces earnings pre-market, or (2) during the EA day when it announces post-market, generally capturing IV at or close to its peak.

This popular screen will give you a list of stocks whose Options premiums tend to rise into Earnings. It includes only those stocks whose Earnings are at least two weeks away from today.

Screen criteria:

  1. Earnings Date Start Date : Current Date + 15 Days
  2. Earnings Date End Date : Current Date + 30 Days
  3. Predicted Move (Next Day) Min : 5%
  4. Options Type: Weekly or Monthly if that lines up with the two to three-week lead-time for entering the trade

Strategy Guideline:

  1. Buy a Straddle at or close to the money two to three weeks pre-EA.
  2. Sell the position either the night before the EA when the company announces earnings pre-market, or during the EA day when it announces post-market.
  3. Expiration date should generally be the closest expiry immediately after the EA.
  4. Straddle price should not be more 60% of predicted move.

Predicted Move (Volatility)

Similar to Implied Volatility in Options. Expected volatility % based on our Proprietary Volatility Predication Model. We are expecting that stock price will likely to reach % in either direction by the end of next trading session after Earnings are released and not necessarily the closing volatility %.

Why is it important?

    This indicator helps

  1. Knowing expected volatility in stocks after Earnings helps to decide trading stocks before Earnings Announcement.
  2. Taking Advantage of volatility collapse following Earnings Results by using Advance Options strategies such as Spread and Straddles.

Since Last Earnings

Change in share price since last Earnings release.

Why is it Important?

When share has gained more than 10% since it's last Earning release, it tends to over react to minor bad news and give up some gains if not all. So, it contains more downside volatility than upside When share has dropped more than 10% since it's last Earning release, it tends to over react to minor good news and recover some drops if not all. So, it contains more upside volatility than downside.

EPS Surprise (%)

Occurs when a company's reported quarterly or annual profits are above or below analysts' expectations. Here is the formula to derive % EPS Surprice:

Actual EPS - Estimated EPS
------------------------------------- x 100
Estimated EPS

Why is it Important?

Earnings surprises can have a huge impact on a company's stock price. Several studies suggest that positive earnings surprises not only lead to an immediate hike in a stock's price, but also to a gradual increase over time. Hence, it's not surprising that some companies are known for routinely beating earning projections. A negative earnings surprise will usually result in a decline in share price.

Next Day Price Change (%)

Next Regular trading session Closing price following Earnings result.

For After Market Close Earnings, It is a next trading day closing price. For Before Market Open Earnings, It is the same trading day closing price.

Why is it Important?

Next Day price change is a reaction of Earnings result.

Robinhood’s Rally Is Reviving Memories Of 2021

Posted on Jul 02, 2026 by Grayson Cavern

Robinhood’s Rally Is Reviving Memories Of 2021

Robinhood Markets (NASDAQ: HOOD) has come full circle. The stock soared shortly after its 2021 IPO as millions of first-time investors piled into meme stocks, options and cryptocurrencies, only to spend the next two years collapsing into single digits as that speculative frenzy disappeared. By the time the dust settled, Robinhood had become Wall Street’s favorite example of what happens when an exciting story grows much faster than the business supporting it.

Today, the conversation looks remarkably different. Robinhood has climbed back above $100 because the company has metamorphosed into something far more durable than the trading app investors chased four years ago. Even so, every time I compare today’s valuation with the expectations surrounding the business, I’m reminded of 2021 since the market once again appears willing to pay tomorrow’s price before tomorrow’s earnings have arrived.

Robinhood Finally Became The Dream Business Investors Imagined


The easiest mistake investors can make is dismissing this rally as another speculative episode. It isn’t. And the numbers don’t even support that conclusion.

First-quarter revenue increased 15% year over year to $1.07 billion, while net income reached $346 million and adjusted EBITDA climbed to $534 million. Platform assets expanded 39% to $307 billion, net deposits totaled $17.7 billion, Robinhood Gold subscribers grew 36% to a record 4.3 million, and funded customers reached 27.4 million. Behind those headline figures sits a business that’s becoming increasingly difficult for customers to leave as subscriptions, retirement accounts, cash management, prediction markets and AI-powered investing tools deepen engagement across the platform.  

Management’s ambition has grown alongside the business. Robinhood is pushing into tokenized assets through Robinhood Chain, expanding Cortex across its platform, building banking products, opening private market access and accelerating its international footprint. Four years ago, investors were paying for the possibility that Robinhood might someday become a financial ecosystem. Today, management is steadily building one.

That’s why the comparison with 2021 becomes so interesting.

The Business Changed. Investor Behaviour Hasn’t.

A better company doesn’t automatically eliminate the risk of paying too much for it.

Robinhood still trades like a business investors expect to execute almost flawlessly over the next several years, and recent announcements reinforce just how ambitious management has become. The company raised $2.2 billion through zero-coupon convertible notes despite already having a strong balance sheet, signaling confidence that future investments in artificial intelligence, acquisitions, and tokenized finance can generate returns well beyond the cost of capital.

At the same time, the quarter reminded investors that parts of the business remain cyclical. Cryptocurrency revenue fell 47% year over year to $134 million, offset by stronger growth in equities, options and event contracts. That’s hardly a reason to abandon the stock, but it is a reminder that Robinhood hasn’t completely escaped the swings in retail participation that defined its earlier years.

That’s the lesson many investors forgot in 2021. Unlike expectations, great businesses rarely disappoint all at once.

Wall Street Is Paying Up Before The Story Fully Plays Out

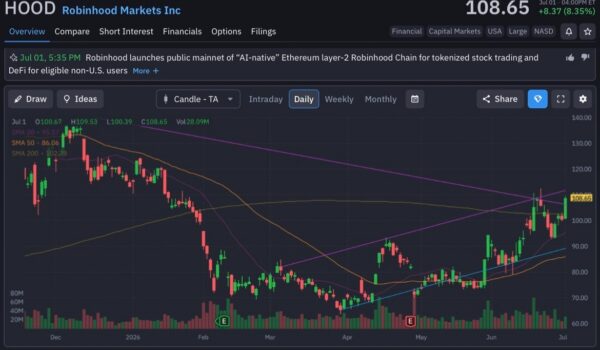
Robinhood’s chart looks quite different from the emotionally charged surge that followed its IPO. Instead of racing vertically before collapsing under its own weight, the stock has spent the past three months steadily repricing higher, climbing from roughly $40 to above $100 while staying comfortably above its 20-day, 50-day and 200-day moving averages. Even the recent pullback found buyers almost immediately around the rising 20-day average, with volume expanding during advances and easing during consolidations. A pattern that usually reflects persistent institutional demand rather than speculative retail chasing.

Investors are no longer waiting for Robinhood to prove it deserves another chance. They’re already positioning for what they believe the business could become over the next several years. That’s exactly why every quarterly report now carries more weight than it did after the IPO. Once a stock has been rerated this aggressively, meeting expectations often isn’t enough. Management has to keep exceeding them

robinhood-StockEarnings

Closing Remarks

Robinhood has earned much of this rally. The platform is stronger, more diversified, and far more resilient than the company investors enthusiastically priced in 2021.

As a short-term trader, I’d spend as much time watching the chart as the income statement because momentum has a habit of carrying premium valuations much further than logic suggests. Fighting strong institutional buying simply because a stock looks expensive has rarely been a profitable strategy.

Long-term investors face a different challenge. I’d be watching whether earnings, customer assets, net deposits, free cash flow and product adoption continue compounding quickly enough to justify a market that’s already looking several years ahead.

Robinhood finally grew into much of the promise investors saw four years ago. The only question left is whether the stock has started pricing the next chapter before management has finished writing this one.

Join over 1.2M+ investors/traders who receive daily and weekly notable earnings alerts with predicted move