ajax loader

Loading...


Ride-the-Wave Strategy – Best for Stock Traders

Ride-the-Wave targets multi-day price momentum following a company’s earnings announcement (EA). With this strategy:

  1. Buy a stock one day post-EA if a stock reacts positively post-earnings:
    1. Near the close of trading the EA-day for a pre-market-EA
    2. Near the close of the following day for a post-market-EA
  2. Sell-to-close after 7-10 days, or possibly earlier if a desired price target is reached

Similarly,

  1. short a stock one day post-EA if a stock reacts negatively post-earnings:
    1. near the close of trading the EA-day for a premarket-EA
    2. near the close of the following day for a post-market-EA
  2. then buy-to-close after 7-10 days, or possibly earlier if a desired price target is reached

Important: Ride-the-Wave is predicated on significant price momentum triggered by an EA. The 7-10 day scenario is the maximum trade hold-time. If you see post EA-momentum is halted or reversed by a significant opposite move, re-evaluate your presence in the trade.

This popular StockEarnings screen below will give you a list of stocks that historically exhibit significant price momentum following an EA for the next seven days:

  1. Stocks exhibiting positive post-EA price moves are buy-candidates
  2. Stocks exhibiting negative post-EA price moves are sell/short-candidates

The screen includes those stocks whose Earnings just came out in last two days.

Screen criteria:

  1. Earnings Date Start Date : Current Date + -1 Day
  2. Earnings Date End Date : Current Date + -2 Days
  3. Predicted Move (Next Day) Max : 7%
  4. Predicted Move (On 7th Day) Min : 7%

Strategy Guideline:

  1. Buy the stock if stock has reacted positively. Short the stock if stock has reacted negatively (see above).
  2. Close the position in 7-10 days, or possibly earlier based on price move.

Volatility Crush Strategy - Best for Options Traders

The Volatility Crush strategy is used with stocks that typically experience relatively low-to-moderate price moves (≤4%) following their Earnings Announcements (EA). The basic trade idea is to sell put or call options right before the EA, collecting a credit when options premium is very high due to elevated implied volatility (IV). You then close the position right after the EA by buying the option back much cheaper due to the significant drop in IV that occurs after the mystery of the EA disappears. In assessing this trade, you need to do your homework to ensure you collect sufficient premium to make the trade worthwhile.

This trade is practical due to the low-to-moderate price-move after the EA, which generally won’t significantly affect the options price, unlike an “action” stock, which experience great price moves post-EA. With these symbols, if you’re on the right side of the price move, that’s a great thing. But if you’re on the wrong side of the move, not so great. Consequently, by minimizing the effect of the post-EA price move, you have a much better chance to profit from the reduction in IV without it being ruined by a violent price move.

For this trade, open the position either (1) the night before the EA when the company announces earnings or (2) during the EA day when it announces post-market, generally capturing IV at or close to its peak.

For this trade, open the position either (1) the night before the EA when the company announces earnings or (2) during the EA day when it announces post-market, generally capturing IV at or close to its peak.

This popular stockearnings screen will give you a list of stocks which do not react more than 4% fpost-EA. It includes only those stocks whose earnings are releasing next day.

Screen criteria:

  1. Earnings Date Start Date : Current Date + 1
  2. Earnings Date End Date : Current Date + 1
  3. Predicted Move (Next Day) Max : 4%
  4. Options Type: Weekly

Strategy Guideline:

  1. Options Strategy: Sell Call and Put
  2. Options Strike Price: Current Stock Price – (% Predicated Move x 2)
  3. Expiration Date: It should generally be the closest expiry immediately after the EA.
  4. Buy Insurance: Buying back Call and Put at Strike price which 10% lower than Sell Strike Price is optional but recommended.

Watch Video for More Detail

Volatility Rush Strategy - Best for Options Traders

The Volatility Rush takes advantage of increasing options premiums into earnings announcements (EA) caused by an anticipated rise in Implied Volatility (IV). With this strategy, Buy a Call and Put at-the-money (a long straddle) 2-3 weeks before the EA when IV is lower. Sell the position either (1) the night before the EA when the company announces earnings pre-market, or (2) during the EA day when it announces post-market, generally capturing IV at or close to its peak.

This popular screen will give you a list of stocks whose Options premiums tend to rise into Earnings. It includes only those stocks whose Earnings are at least two weeks away from today.

Screen criteria:

  1. Earnings Date Start Date : Current Date + 15 Days
  2. Earnings Date End Date : Current Date + 30 Days
  3. Predicted Move (Next Day) Min : 5%
  4. Options Type: Weekly or Monthly if that lines up with the two to three-week lead-time for entering the trade

Strategy Guideline:

  1. Buy a Straddle at or close to the money two to three weeks pre-EA.
  2. Sell the position either the night before the EA when the company announces earnings pre-market, or during the EA day when it announces post-market.
  3. Expiration date should generally be the closest expiry immediately after the EA.
  4. Straddle price should not be more 60% of predicted move.

Predicted Move (Volatility)

Similar to Implied Volatility in Options. Expected volatility % based on our Proprietary Volatility Predication Model. We are expecting that stock price will likely to reach % in either direction by the end of next trading session after Earnings are released and not necessarily the closing volatility %.

Why is it important?

    This indicator helps

  1. Knowing expected volatility in stocks after Earnings helps to decide trading stocks before Earnings Announcement.
  2. Taking Advantage of volatility collapse following Earnings Results by using Advance Options strategies such as Spread and Straddles.

Since Last Earnings

Change in share price since last Earnings release.

Why is it Important?

When share has gained more than 10% since it's last Earning release, it tends to over react to minor bad news and give up some gains if not all. So, it contains more downside volatility than upside When share has dropped more than 10% since it's last Earning release, it tends to over react to minor good news and recover some drops if not all. So, it contains more upside volatility than downside.

EPS Surprise (%)

Occurs when a company's reported quarterly or annual profits are above or below analysts' expectations. Here is the formula to derive % EPS Surprice:

Actual EPS - Estimated EPS
------------------------------------- x 100
Estimated EPS

Why is it Important?

Earnings surprises can have a huge impact on a company's stock price. Several studies suggest that positive earnings surprises not only lead to an immediate hike in a stock's price, but also to a gradual increase over time. Hence, it's not surprising that some companies are known for routinely beating earning projections. A negative earnings surprise will usually result in a decline in share price.

Next Day Price Change (%)

Next Regular trading session Closing price following Earnings result.

For After Market Close Earnings, It is a next trading day closing price. For Before Market Open Earnings, It is the same trading day closing price.

Why is it Important?

Next Day price change is a reaction of Earnings result.

Lululemon Faces a Nike-Style Reckoning After Weak Q1  

Posted on Jun 08, 2026 by Chris Markoch

Lululemon Faces a Nike-Style Reckoning After Weak Q1  

Life comes at you fast when you’re a leading consumer brand. Just a few years ago, Lululemon Athletica Inc. (NASDAQ: LULU) was synonymous with athleisure. In fact, the company’s signature leggings were almost like saying “Kleenex” instead of “facial tissue.”  

However, a confluence of factors has pushed LULU lower, and the bottom may not yet be in. Competition has emerged that offers “good enough” quality at a dramatically lower price. That plays into the inflation narrative as customers are being more “choiceful” (hint: that doesn’t include Lululemon). 

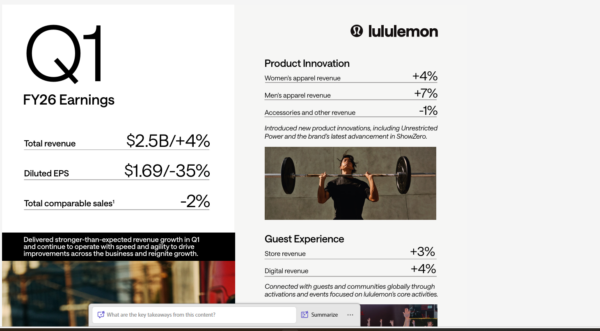
All of these factors converged in the company’s Q1 earnings report for its 2026 fiscal year. The headline numbers will show a double beat. But investors didn’t believe that was nearly good enough. LULU stock dropped 8.5% to make a new 52-week low. That drop occurred with a volume nearly 5x the average. 

The Numbers Behind the Headlines 


Revenue rose 4% to $2.47 billion in Q1 FY2026, but the real story is in the margins. Gross margin collapsed 410 basis points to 54.2%, and operating margin fell 730 basis points to just 11.2%. Diluted EPS came in at $1.69, down sharply from $2.60 a year ago. Management’s full-year guidance now calls for revenue of $11.0 billion to $11.15 billion — essentially flat to slightly down versus fiscal 2025. 

The geographic split tells two different stories. Americas revenue fell 3% reported, or 4% on a constant-dollar basis, with comparable sales down 5% to 6%. International revenue surged 22% reported and 16% in constant dollars, led by China Mainland, which grew 30% in reported terms and 23% on a constant-dollar basis. Rest of World — primarily Europe and broader Asia-Pacific — grew 13% reported and 9% in constant dollars. International is carrying the company, but it isn’t large enough yet to offset the Americas’ drag. 

lululemon - StockEarnings

A Brand Problem, not a Macro Problem 

The core issue is one of brand equity. Competing with more nimble competitors means competing on price. However, that takes some of the allure out of owning apparel with that logo. It was a status symbol. Now it may be a sign that customers are paying too much for too little.  

It’s important to remember that Lululemon is a premium brand that’s struggling. It’s not credible for management to cite the pressures that other retailers are noting from the lower leg of the K-shaped consumer economy. The target customers for Lululemon shouldn’t be under the same duress.  

It has echoes of Nike Inc. (NYSE: NKE). Nike had a longer runway to be the king of the performance athletic shoe sector. But the company’s fall from grace has been just as noticeable to consumers and investors. 

That leads to the biggest problem. Nike has made a concerted effort on a turnaround strategy. But it’s been many years, and there’s not a lot to show for it.  

Tariffs Add Another Layer of Pain 

Lululemon’s margin pressure is more than a demand story. Supply chain costs are compounding it. The company sources roughly 40% of its manufacturing from Vietnam and 28% of its fabrics from mainland China. These have been two of the hardest-hit regions under the current U.S. tariff regime. Management’s guidance explicitly assumes 30% tariffs on Chinese imports and elevated rates on other sourcing countries.  

The company flagged that tariffs and the elimination of the de minimis exemption are expected to hit gross profit by approximately $240 million in fiscal 2025. That headwind carries into 2026, and guidance explicitly excludes any potential IEEPA tariff refunds — meaning upside from trade relief isn’t being counted on. 

The Reaction Was Swift and Severe 

In many cases, an earnings report shouldn’t be taken at face value. Frequently, analysts find nuances that cause them to take a day or more after earnings to render a verdict.  

That wasn’t the case with the LULU earnings report. Nearly 20 analysts weighed in on the day after Lululemon reported. With one exception, analysts either lowered their price target or downgraded LULU. In some cases, they did both. The one exception came from Freedom Capital. However, the upgrade was to a Hold from a rare Strong Sell.  

But as bad as that is, that’s not the real story. In the last 12 months, the consensus price target for LULU stock has been cut by over 50%. And many of the new analysts’ price targets are well below the consensus price of $165.13.  

The Chart Confirms the Damage

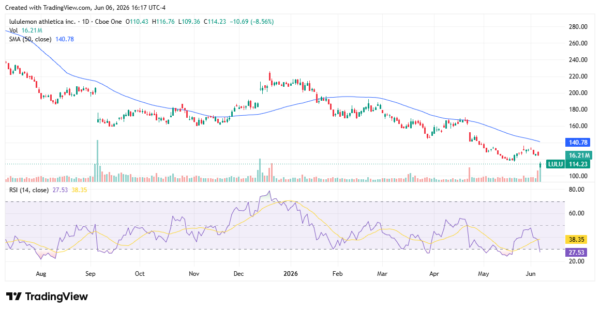
The technical picture offers little comfort. LULU is trading at $114, well below its 50-day moving average of $140.78 — a level that has now flipped into firm resistance after acting as support earlier in the year. The stock has been in a sustained downtrend since peaking near $230 in late 2025, a decline of roughly 50% over the past year.

The RSI tells a conflicted story. The 14-period RSI sits at 27.53, deep in oversold territory — a level that historically precedes at least a short-term bounce. However, the signal-line RSI at 38.35 hasn’t confirmed a reversal, and oversold conditions in a downtrend can persist longer than investors expect. Today’s volume spike on an earnings miss is also a concern — high-volume breakdowns often mark capitulation, but they can also accelerate the move before a floor is found.

For LULU to reclaim technical ground, it would need to close back above the $130 to $135 range and begin compressing the gap with the 50-day moving average. Until then, the path of least resistance remains lower.

lululemon - StockEarnings

How Lululemon Can Make a Comeback 

Industry analysts believe the company may get a boost from the GLP-1 movement. Bank of America analysts projected that weight loss from GLP-1s could drive wardrobe revamps, particularly among the affluent, and that athletic apparel brands like Lululemon could benefit from healthier lifestyles.  

That opinion was seconded by Bernstein’s apparel analyst, Aneesha Sherman, who noted that a wide swath of retailers could benefit from GLP-1 users refreshing their wardrobes, specifically naming Lululemon.  

Industry commentary has noted that specialty retailers like Lululemon are reporting growth in activewear sales as GLP-1 users embrace new fitness goals, while fast-fashion retailers with broader size ranges have seen more uneven results. 

Challenges Remain, But Lululemon Can Recover 

Lululemon has achieved iconic brand status in a short period of time. That’s a halo that doesn’t lose its shine quickly. However, when wallets tighten, a $100 price tag with a logo on it stops being a status symbol and starts being a target.

But that could change if the economic growth suggested by the May Jobs report begins to spread. The logo still means something. The question is whether management can remind consumers why, before a cheaper alternative becomes the new default.

A former marketing copywriter turned freelance financial writer and market analyst. I have a passion for delivering insights to investors. I write regularly about stocks for StockEarnings and MarketBeat. Posts are not advice.

Join over 1.2M+ investors/traders who receive daily and weekly notable earnings alerts with predicted move