ajax loader

Loading...


Ride-the-Wave Strategy – Best for Stock Traders

Ride-the-Wave targets multi-day price momentum following a company’s earnings announcement (EA). With this strategy:

  1. Buy a stock one day post-EA if a stock reacts positively post-earnings:
    1. Near the close of trading the EA-day for a pre-market-EA
    2. Near the close of the following day for a post-market-EA
  2. Sell-to-close after 7-10 days, or possibly earlier if a desired price target is reached

Similarly,

  1. short a stock one day post-EA if a stock reacts negatively post-earnings:
    1. near the close of trading the EA-day for a premarket-EA
    2. near the close of the following day for a post-market-EA
  2. then buy-to-close after 7-10 days, or possibly earlier if a desired price target is reached

Important: Ride-the-Wave is predicated on significant price momentum triggered by an EA. The 7-10 day scenario is the maximum trade hold-time. If you see post EA-momentum is halted or reversed by a significant opposite move, re-evaluate your presence in the trade.

This popular StockEarnings screen below will give you a list of stocks that historically exhibit significant price momentum following an EA for the next seven days:

  1. Stocks exhibiting positive post-EA price moves are buy-candidates
  2. Stocks exhibiting negative post-EA price moves are sell/short-candidates

The screen includes those stocks whose Earnings just came out in last two days.

Screen criteria:

  1. Earnings Date Start Date : Current Date + -1 Day
  2. Earnings Date End Date : Current Date + -2 Days
  3. Predicted Move (Next Day) Max : 7%
  4. Predicted Move (On 7th Day) Min : 7%

Strategy Guideline:

  1. Buy the stock if stock has reacted positively. Short the stock if stock has reacted negatively (see above).
  2. Close the position in 7-10 days, or possibly earlier based on price move.

Volatility Crush Strategy - Best for Options Traders

The Volatility Crush strategy is used with stocks that typically experience relatively low-to-moderate price moves (≤4%) following their Earnings Announcements (EA). The basic trade idea is to sell put or call options right before the EA, collecting a credit when options premium is very high due to elevated implied volatility (IV). You then close the position right after the EA by buying the option back much cheaper due to the significant drop in IV that occurs after the mystery of the EA disappears. In assessing this trade, you need to do your homework to ensure you collect sufficient premium to make the trade worthwhile.

This trade is practical due to the low-to-moderate price-move after the EA, which generally won’t significantly affect the options price, unlike an “action” stock, which experience great price moves post-EA. With these symbols, if you’re on the right side of the price move, that’s a great thing. But if you’re on the wrong side of the move, not so great. Consequently, by minimizing the effect of the post-EA price move, you have a much better chance to profit from the reduction in IV without it being ruined by a violent price move.

For this trade, open the position either (1) the night before the EA when the company announces earnings or (2) during the EA day when it announces post-market, generally capturing IV at or close to its peak.

For this trade, open the position either (1) the night before the EA when the company announces earnings or (2) during the EA day when it announces post-market, generally capturing IV at or close to its peak.

This popular stockearnings screen will give you a list of stocks which do not react more than 4% fpost-EA. It includes only those stocks whose earnings are releasing next day.

Screen criteria:

  1. Earnings Date Start Date : Current Date + 1
  2. Earnings Date End Date : Current Date + 1
  3. Predicted Move (Next Day) Max : 4%
  4. Options Type: Weekly

Strategy Guideline:

  1. Options Strategy: Sell Call and Put
  2. Options Strike Price: Current Stock Price – (% Predicated Move x 2)
  3. Expiration Date: It should generally be the closest expiry immediately after the EA.
  4. Buy Insurance: Buying back Call and Put at Strike price which 10% lower than Sell Strike Price is optional but recommended.

Watch Video for More Detail

Volatility Rush Strategy - Best for Options Traders

The Volatility Rush takes advantage of increasing options premiums into earnings announcements (EA) caused by an anticipated rise in Implied Volatility (IV). With this strategy, Buy a Call and Put at-the-money (a long straddle) 2-3 weeks before the EA when IV is lower. Sell the position either (1) the night before the EA when the company announces earnings pre-market, or (2) during the EA day when it announces post-market, generally capturing IV at or close to its peak.

This popular screen will give you a list of stocks whose Options premiums tend to rise into Earnings. It includes only those stocks whose Earnings are at least two weeks away from today.

Screen criteria:

  1. Earnings Date Start Date : Current Date + 15 Days
  2. Earnings Date End Date : Current Date + 30 Days
  3. Predicted Move (Next Day) Min : 5%
  4. Options Type: Weekly or Monthly if that lines up with the two to three-week lead-time for entering the trade

Strategy Guideline:

  1. Buy a Straddle at or close to the money two to three weeks pre-EA.
  2. Sell the position either the night before the EA when the company announces earnings pre-market, or during the EA day when it announces post-market.
  3. Expiration date should generally be the closest expiry immediately after the EA.
  4. Straddle price should not be more 60% of predicted move.

Predicted Move (Volatility)

Similar to Implied Volatility in Options. Expected volatility % based on our Proprietary Volatility Predication Model. We are expecting that stock price will likely to reach % in either direction by the end of next trading session after Earnings are released and not necessarily the closing volatility %.

Why is it important?

    This indicator helps

  1. Knowing expected volatility in stocks after Earnings helps to decide trading stocks before Earnings Announcement.
  2. Taking Advantage of volatility collapse following Earnings Results by using Advance Options strategies such as Spread and Straddles.

Since Last Earnings

Change in share price since last Earnings release.

Why is it Important?

When share has gained more than 10% since it's last Earning release, it tends to over react to minor bad news and give up some gains if not all. So, it contains more downside volatility than upside When share has dropped more than 10% since it's last Earning release, it tends to over react to minor good news and recover some drops if not all. So, it contains more upside volatility than downside.

EPS Surprise (%)

Occurs when a company's reported quarterly or annual profits are above or below analysts' expectations. Here is the formula to derive % EPS Surprice:

Actual EPS - Estimated EPS
------------------------------------- x 100
Estimated EPS

Why is it Important?

Earnings surprises can have a huge impact on a company's stock price. Several studies suggest that positive earnings surprises not only lead to an immediate hike in a stock's price, but also to a gradual increase over time. Hence, it's not surprising that some companies are known for routinely beating earning projections. A negative earnings surprise will usually result in a decline in share price.

Next Day Price Change (%)

Next Regular trading session Closing price following Earnings result.

For After Market Close Earnings, It is a next trading day closing price. For Before Market Open Earnings, It is the same trading day closing price.

Why is it Important?

Next Day price change is a reaction of Earnings result.

AI Boom: Why Citi Hiked its S&P 500 Price Target to 8,100

Posted on Jun 08, 2026 by Ian Cooper

AI Boom: Why Citi Hiked its S&P 500 Price Target to 8,100

Earnings growth driven by the artificial intelligence (AI) boom will send the S&P 500 above 8,000 mark in 2026, according to Citi. In fact, strategist Scott Chronert says he expects to see earnings of $350 per share for the S&P in 2026, with that number rising to $400 in 2027. “AI tailwinds are fueling an episodic fundamental surge across related sectors,” he said, as quoted by CNBC. “We have high confidence in continued earnings beats through year-end.”

“We presume that fundamentals and related price action tell us we’re in middle innings. In turn, both trailing and forward PEs should be expected to moderate going forward, thus increasing the burden on earnings growth and related expectation to drive index price action.”

The AI Boom Shows No Signs of Slowing Down


With the global AI market already surpassing $230 billion in 2024, analysts now see a clear path to multi-trillion-dollar expansion—and the next five years may deliver the strongest gains yet.

Forecasts now place AI’s value between $1.7 and $3.5 trillion by the early 2030s, with the most aggressive estimates topping $7 trillion by 2035. And judging by the surge in corporate investment, the market is moving toward the high end of those projections.

Plus, we have to consider that artificial intelligence will continue to create massive demand for data centers, which will lead to further demand for NAND. After all, NAND is a vital part of the AI infrastructure for massive amounts of data storage, speed and performance. We also have to consider that demand for more data centers (which will need more NAND) are exploding.

The data tells the story

According to MIT Technology Review, there are about 3,000 data centers across the U.S. Plus, according to a report from McKinsey, $5.2 trillion in AI infrastructure investments will be needed by 2030. Again, growing demand for data centers will mean growing demand for more NAND memory in an already tight market.

In addition, “As the demand for data processing and storage continues to surge, data centers are experiencing unprecedented growth. McKinsey’s analysis ‘suggests that demand for AI-ready data center capacity will rise at an average rate of 33 percent a year between 2023 and 2030 (reflecting a trend that is already underway.),’” according to analysts at McKinsey, as reported by BOMA International.

The “AI Bubble” Argument Is Fading

Warnings of an “AI bubble” are increasingly being dismissed by top analysts.

Goldman Sachs says, “it believes the AI story is just getting started – and the investments that seem huge today will be dwarfed by the benefits AI will deliver,” as noted by Quartz.com

Long term, the investment bank says that AI adoption could add $20 trillion to the U.S. economy. AI, according to Goldman Sachs, is already delivering those gains in productivity when deployed right.”

JPMorgan’s Mary Callahan Erdoes added, “AI is presenting opportunities not fully appreciated or understood yet,” as noted by CNBC. “AI itself is not a bubble. That’s a crazy concept… We are on the precipice of a major, major revolution in a way that companies operate.”

How Investors Can Tap Into the AI Boom

One way is to invest in heavyweights like Nvidia (NASDAQ: NVDA) and Advanced Micro Devices (NASDAQ: AMD).

Or, if you prefer to diversify, consider ETFs such as:

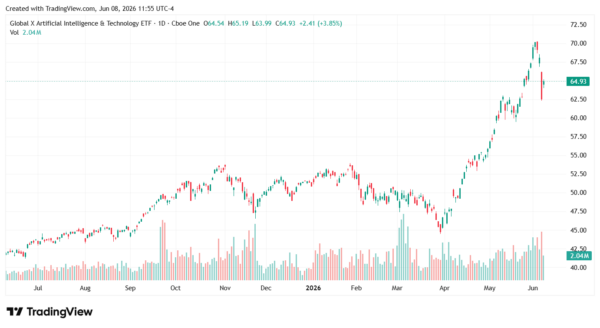
One of the Leading AI-Focused ETFs

If you want to diversify at a lower cost, there are ETFs like the Global X Artificial Intelligence & Technology ETF (NASDAQ: AIQ). With an expense ratio of 0.68%, the ETF invests in companies that may benefit from the continued development and use of artificial intelligence (AI). Some of its top holdings include Palantir, Oracle, Broadcom, Netflix, Nvidia, Microsoft, and Meta Platforms, to name a few of its 86 total holdings. 

AI Boom-StockEarnings

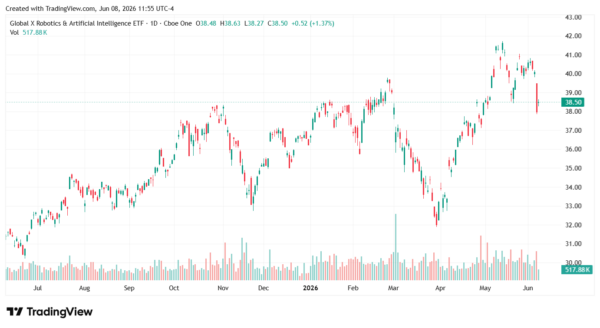
A Core ETF for Automation and AI Expansion

Another top AI ETF to consider is the Global X Robotics and Artificial Intelligence ETF (NASDAQ: BOTZ). With an expense ratio of 0.68%, the ETF invests in companies that should benefit from the increased adoption of robotics and AI. Some of its 49 holdings include Nvidia, Keyence, DynaTrace, SMC Corp., Intuitive Surgical, Upstart Holdings, and C3.ai.

AI Boom-StockEarnings

Over the last 26 years, he’s taught thousands of investors how to trade news flow and herd mentality using a unique blend of technical and fundamental analysis. Cooper was among the few analysts to spot the financial crisis of 2008, the top of subprime and Alt-A, the death of Lehman Brothers, Bear Stearns, and New Century Financial, and even the Dow’s collapse to 6,500, as well as its recovery. He even called for gold to rally well above $1.500 when it traded under $600. At the moment, Cooper makes use of technical, fundamental and news analysis, to help individual investors grow their wealth. He’s a firm believer that hard work and thorough research will lead to investment success.

Join over 1.2M+ investors/traders who receive daily and weekly notable earnings alerts with predicted move