ajax loader

Loading...


Ride-the-Wave Strategy – Best for Stock Traders

Ride-the-Wave targets multi-day price momentum following a company’s earnings announcement (EA). With this strategy:

  1. Buy a stock one day post-EA if a stock reacts positively post-earnings:
    1. Near the close of trading the EA-day for a pre-market-EA
    2. Near the close of the following day for a post-market-EA
  2. Sell-to-close after 7-10 days, or possibly earlier if a desired price target is reached

Similarly,

  1. short a stock one day post-EA if a stock reacts negatively post-earnings:
    1. near the close of trading the EA-day for a premarket-EA
    2. near the close of the following day for a post-market-EA
  2. then buy-to-close after 7-10 days, or possibly earlier if a desired price target is reached

Important: Ride-the-Wave is predicated on significant price momentum triggered by an EA. The 7-10 day scenario is the maximum trade hold-time. If you see post EA-momentum is halted or reversed by a significant opposite move, re-evaluate your presence in the trade.

This popular StockEarnings screen below will give you a list of stocks that historically exhibit significant price momentum following an EA for the next seven days:

  1. Stocks exhibiting positive post-EA price moves are buy-candidates
  2. Stocks exhibiting negative post-EA price moves are sell/short-candidates

The screen includes those stocks whose Earnings just came out in last two days.

Screen criteria:

  1. Earnings Date Start Date : Current Date + -1 Day
  2. Earnings Date End Date : Current Date + -2 Days
  3. Predicted Move (Next Day) Max : 7%
  4. Predicted Move (On 7th Day) Min : 7%

Strategy Guideline:

  1. Buy the stock if stock has reacted positively. Short the stock if stock has reacted negatively (see above).
  2. Close the position in 7-10 days, or possibly earlier based on price move.

Volatility Crush Strategy - Best for Options Traders

The Volatility Crush strategy is used with stocks that typically experience relatively low-to-moderate price moves (≤4%) following their Earnings Announcements (EA). The basic trade idea is to sell put or call options right before the EA, collecting a credit when options premium is very high due to elevated implied volatility (IV). You then close the position right after the EA by buying the option back much cheaper due to the significant drop in IV that occurs after the mystery of the EA disappears. In assessing this trade, you need to do your homework to ensure you collect sufficient premium to make the trade worthwhile.

This trade is practical due to the low-to-moderate price-move after the EA, which generally won’t significantly affect the options price, unlike an “action” stock, which experience great price moves post-EA. With these symbols, if you’re on the right side of the price move, that’s a great thing. But if you’re on the wrong side of the move, not so great. Consequently, by minimizing the effect of the post-EA price move, you have a much better chance to profit from the reduction in IV without it being ruined by a violent price move.

For this trade, open the position either (1) the night before the EA when the company announces earnings or (2) during the EA day when it announces post-market, generally capturing IV at or close to its peak.

For this trade, open the position either (1) the night before the EA when the company announces earnings or (2) during the EA day when it announces post-market, generally capturing IV at or close to its peak.

This popular stockearnings screen will give you a list of stocks which do not react more than 4% fpost-EA. It includes only those stocks whose earnings are releasing next day.

Screen criteria:

  1. Earnings Date Start Date : Current Date + 1
  2. Earnings Date End Date : Current Date + 1
  3. Predicted Move (Next Day) Max : 4%
  4. Options Type: Weekly

Strategy Guideline:

  1. Options Strategy: Sell Call and Put
  2. Options Strike Price: Current Stock Price – (% Predicated Move x 2)
  3. Expiration Date: It should generally be the closest expiry immediately after the EA.
  4. Buy Insurance: Buying back Call and Put at Strike price which 10% lower than Sell Strike Price is optional but recommended.

Watch Video for More Detail

Volatility Rush Strategy - Best for Options Traders

The Volatility Rush takes advantage of increasing options premiums into earnings announcements (EA) caused by an anticipated rise in Implied Volatility (IV). With this strategy, Buy a Call and Put at-the-money (a long straddle) 2-3 weeks before the EA when IV is lower. Sell the position either (1) the night before the EA when the company announces earnings pre-market, or (2) during the EA day when it announces post-market, generally capturing IV at or close to its peak.

This popular screen will give you a list of stocks whose Options premiums tend to rise into Earnings. It includes only those stocks whose Earnings are at least two weeks away from today.

Screen criteria:

  1. Earnings Date Start Date : Current Date + 15 Days
  2. Earnings Date End Date : Current Date + 30 Days
  3. Predicted Move (Next Day) Min : 5%
  4. Options Type: Weekly or Monthly if that lines up with the two to three-week lead-time for entering the trade

Strategy Guideline:

  1. Buy a Straddle at or close to the money two to three weeks pre-EA.
  2. Sell the position either the night before the EA when the company announces earnings pre-market, or during the EA day when it announces post-market.
  3. Expiration date should generally be the closest expiry immediately after the EA.
  4. Straddle price should not be more 60% of predicted move.

Predicted Move (Volatility)

Similar to Implied Volatility in Options. Expected volatility % based on our Proprietary Volatility Predication Model. We are expecting that stock price will likely to reach % in either direction by the end of next trading session after Earnings are released and not necessarily the closing volatility %.

Why is it important?

    This indicator helps

  1. Knowing expected volatility in stocks after Earnings helps to decide trading stocks before Earnings Announcement.
  2. Taking Advantage of volatility collapse following Earnings Results by using Advance Options strategies such as Spread and Straddles.

Since Last Earnings

Change in share price since last Earnings release.

Why is it Important?

When share has gained more than 10% since it's last Earning release, it tends to over react to minor bad news and give up some gains if not all. So, it contains more downside volatility than upside When share has dropped more than 10% since it's last Earning release, it tends to over react to minor good news and recover some drops if not all. So, it contains more upside volatility than downside.

EPS Surprise (%)

Occurs when a company's reported quarterly or annual profits are above or below analysts' expectations. Here is the formula to derive % EPS Surprice:

Actual EPS - Estimated EPS
------------------------------------- x 100
Estimated EPS

Why is it Important?

Earnings surprises can have a huge impact on a company's stock price. Several studies suggest that positive earnings surprises not only lead to an immediate hike in a stock's price, but also to a gradual increase over time. Hence, it's not surprising that some companies are known for routinely beating earning projections. A negative earnings surprise will usually result in a decline in share price.

Next Day Price Change (%)

Next Regular trading session Closing price following Earnings result.

For After Market Close Earnings, It is a next trading day closing price. For Before Market Open Earnings, It is the same trading day closing price.

Why is it Important?

Next Day price change is a reaction of Earnings result.

Broadcom Earnings: Wall Street Is Fighting The Wrong Battle

Posted on Jun 05, 2026 by Grayson Cavern

Broadcom Earnings: Wall Street Is Fighting The Wrong Battle

During the internet boom, Cisco reached a stage where good quarters became a liability. Investors stopped asking whether the company performed well and started asking whether it performed well enough to justify the future they had already priced into the stock. Once expectations detach from reality, beating estimates becomes less important than beating imagination.

That was my first thought after reading the latest results from Broadcom Inc (NASDAQ: AVGO).

Broadcom reported second-quarter earnings with a revenue of $22.19 billion, up 48% year over year, while non-GAAP earnings per share climbed 54% to $2.44. The company also generated $15.19 billion in adjusted EBITDA and $10.26 billion in free cash flow during the quarter. 

Then the stock fell as investors demanded perfection from the company.

Investor Expectations Got Ahead Of Them


Revenue is rarely the most interesting figure in an earnings report, especially when you’re dealing with a company generating more than $22 billion per quarter. What interested me was how many parts of the business accelerated simultaneously.

AI revenue reached $10.8 billion during the quarter, up from $8.4 billion in the previous quarter and more than double the level reported a year ago. Semiconductor revenue climbed from $12.5 billion to $15 billion quarter over quarter, while infrastructure software revenue increased from roughly $6.7 billion to $7.2 billion.

Management then guided for approximately $16 billion in AI revenue next quarter, which means Broadcom expects to generate more from AI alone in a single quarter than many semiconductor companies produce in total annual sales. That is an extraordinary one by any reasonable standard. 

Yet the post-earnings conversation shifted almost immediately toward what Broadcom didn’t do. Some investors wanted a larger guidance raise, others wanted management to expand its long-term AI opportunity framework again, and others focused on VMware pricing dynamics and whether hyperscaler spending can sustain this trajectory indefinitely. Nobody was seriously debating whether Broadcom had a great quarter. They were debating whether it had a legendary one, and that is a fundamentally different standard to apply to any business operating in the real world. 

While Investors Argue About VMware, Broadcom Was Building Something Else

One reason I think Wall Street is fighting the wrong battle is because the company’s actions tell a different story than the conversation surrounding the stock.

While investors spent earnings night arguing about VMware pricing, customer churn, and software licensing, Broadcom spent the last year embedding itself deeper into the infrastructure powering the AI buildout.

The company expanded its partnership with Meta Platforms (NASDAQ: META) to deploy networking technologies across next-generation AI systems. It expanded collaboration with Alphabet’s (NASDAQ: GOOGL) Google Cloud to strengthen cloud networking infrastructure. It shipped its 3.5D Face-to-Face Compute System-on-Chip, designed to support increasingly complex AI workloads. It also launched the industry’s first 400G-per-lane optical DSP platform built for next-generation AI networking…

…all within the same period the market was fixating on whether guidance was wide enough. Those announcements reveal where management believes the durable value in this business actually sits, and it is not in defending a mature software acquisition. It is becoming structurally indispensable to the largest infrastructure buildout of this generation, which is a different and more powerful position to occupy. 

The Chart Suggests Profit Taking, Not A Broken Story

The price action surrounding this earnings report deserves careful reading rather than a reflexive interpretation, because the context changes what the volume and the selloff actually mean. 

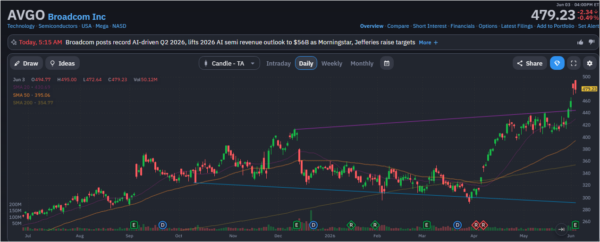
Broadcom entered earnings after a sustained rally that carried shares from roughly $290 in April to nearly $518 before the report – a move driven by institutional capital allocating aggressively into a theme it believes can keep compounding, not retail speculation chasing momentum. 

The post-earnings decline arrived on volume exceeding 58 million shares, one of the heaviest trading sessions visible on the chart, which under normal circumstances would warrant serious concern about distribution.

But even after that decline, Broadcom remains well above its rising 50-day moving average and significantly above its 200-day moving average, with both continuing to point higher. And more tellingly, buyers stepped in around the same price levels where the stock previously consolidated during May, which tells you institutions were willing to actively defend positions despite the disappointment around guidance and the reset in near-term expectations. Momentum cooled. 

The trend didn’t break. That distinction is the entire ballgame when you are trying to separate a temporary reset from a genuine deterioration in the thesis.

Broadcom-StocksEarning

I’d Buy This Dip

I understand why traders sold Broadcom after earnings. I don’t agree with them.

When I look at this quarter, I see revenue growing 48%, earnings growing 54%, AI revenue reaching $10.8 billion, free cash flow exceeding $10 billion, and management guiding for roughly $16 billion in AI revenue next quarter. Not to mention the deepening relationships with Meta and Google while launching products designed for larger and more demanding AI clusters.

Most importantly, I see a stock being punished for failing to exceed expectations that had become detached from reality. When a company executing at this level gets sold because investors wanted something even better, I have historically seen opportunity on the other side of that reaction, not a warning to step away from it.

Join over 1.2M+ investors/traders who receive daily and weekly notable earnings alerts with predicted move