ajax loader

Loading...


Ride-the-Wave Strategy – Best for Stock Traders

Ride-the-Wave targets multi-day price momentum following a company’s earnings announcement (EA). With this strategy:

  1. Buy a stock one day post-EA if a stock reacts positively post-earnings:
    1. Near the close of trading the EA-day for a pre-market-EA
    2. Near the close of the following day for a post-market-EA
  2. Sell-to-close after 7-10 days, or possibly earlier if a desired price target is reached

Similarly,

  1. short a stock one day post-EA if a stock reacts negatively post-earnings:
    1. near the close of trading the EA-day for a premarket-EA
    2. near the close of the following day for a post-market-EA
  2. then buy-to-close after 7-10 days, or possibly earlier if a desired price target is reached

Important: Ride-the-Wave is predicated on significant price momentum triggered by an EA. The 7-10 day scenario is the maximum trade hold-time. If you see post EA-momentum is halted or reversed by a significant opposite move, re-evaluate your presence in the trade.

This popular StockEarnings screen below will give you a list of stocks that historically exhibit significant price momentum following an EA for the next seven days:

  1. Stocks exhibiting positive post-EA price moves are buy-candidates
  2. Stocks exhibiting negative post-EA price moves are sell/short-candidates

The screen includes those stocks whose Earnings just came out in last two days.

Screen criteria:

  1. Earnings Date Start Date : Current Date + -1 Day
  2. Earnings Date End Date : Current Date + -2 Days
  3. Predicted Move (Next Day) Max : 7%
  4. Predicted Move (On 7th Day) Min : 7%

Strategy Guideline:

  1. Buy the stock if stock has reacted positively. Short the stock if stock has reacted negatively (see above).
  2. Close the position in 7-10 days, or possibly earlier based on price move.

Volatility Crush Strategy - Best for Options Traders

The Volatility Crush strategy is used with stocks that typically experience relatively low-to-moderate price moves (≤4%) following their Earnings Announcements (EA). The basic trade idea is to sell put or call options right before the EA, collecting a credit when options premium is very high due to elevated implied volatility (IV). You then close the position right after the EA by buying the option back much cheaper due to the significant drop in IV that occurs after the mystery of the EA disappears. In assessing this trade, you need to do your homework to ensure you collect sufficient premium to make the trade worthwhile.

This trade is practical due to the low-to-moderate price-move after the EA, which generally won’t significantly affect the options price, unlike an “action” stock, which experience great price moves post-EA. With these symbols, if you’re on the right side of the price move, that’s a great thing. But if you’re on the wrong side of the move, not so great. Consequently, by minimizing the effect of the post-EA price move, you have a much better chance to profit from the reduction in IV without it being ruined by a violent price move.

For this trade, open the position either (1) the night before the EA when the company announces earnings or (2) during the EA day when it announces post-market, generally capturing IV at or close to its peak.

For this trade, open the position either (1) the night before the EA when the company announces earnings or (2) during the EA day when it announces post-market, generally capturing IV at or close to its peak.

This popular stockearnings screen will give you a list of stocks which do not react more than 4% fpost-EA. It includes only those stocks whose earnings are releasing next day.

Screen criteria:

  1. Earnings Date Start Date : Current Date + 1
  2. Earnings Date End Date : Current Date + 1
  3. Predicted Move (Next Day) Max : 4%
  4. Options Type: Weekly

Strategy Guideline:

  1. Options Strategy: Sell Call and Put
  2. Options Strike Price: Current Stock Price – (% Predicated Move x 2)
  3. Expiration Date: It should generally be the closest expiry immediately after the EA.
  4. Buy Insurance: Buying back Call and Put at Strike price which 10% lower than Sell Strike Price is optional but recommended.

Watch Video for More Detail

Volatility Rush Strategy - Best for Options Traders

The Volatility Rush takes advantage of increasing options premiums into earnings announcements (EA) caused by an anticipated rise in Implied Volatility (IV). With this strategy, Buy a Call and Put at-the-money (a long straddle) 2-3 weeks before the EA when IV is lower. Sell the position either (1) the night before the EA when the company announces earnings pre-market, or (2) during the EA day when it announces post-market, generally capturing IV at or close to its peak.

This popular screen will give you a list of stocks whose Options premiums tend to rise into Earnings. It includes only those stocks whose Earnings are at least two weeks away from today.

Screen criteria:

  1. Earnings Date Start Date : Current Date + 15 Days
  2. Earnings Date End Date : Current Date + 30 Days
  3. Predicted Move (Next Day) Min : 5%
  4. Options Type: Weekly or Monthly if that lines up with the two to three-week lead-time for entering the trade

Strategy Guideline:

  1. Buy a Straddle at or close to the money two to three weeks pre-EA.
  2. Sell the position either the night before the EA when the company announces earnings pre-market, or during the EA day when it announces post-market.
  3. Expiration date should generally be the closest expiry immediately after the EA.
  4. Straddle price should not be more 60% of predicted move.

Predicted Move (Volatility)

Similar to Implied Volatility in Options. Expected volatility % based on our Proprietary Volatility Predication Model. We are expecting that stock price will likely to reach % in either direction by the end of next trading session after Earnings are released and not necessarily the closing volatility %.

Why is it important?

    This indicator helps

  1. Knowing expected volatility in stocks after Earnings helps to decide trading stocks before Earnings Announcement.
  2. Taking Advantage of volatility collapse following Earnings Results by using Advance Options strategies such as Spread and Straddles.

Since Last Earnings

Change in share price since last Earnings release.

Why is it Important?

When share has gained more than 10% since it's last Earning release, it tends to over react to minor bad news and give up some gains if not all. So, it contains more downside volatility than upside When share has dropped more than 10% since it's last Earning release, it tends to over react to minor good news and recover some drops if not all. So, it contains more upside volatility than downside.

EPS Surprise (%)

Occurs when a company's reported quarterly or annual profits are above or below analysts' expectations. Here is the formula to derive % EPS Surprice:

Actual EPS - Estimated EPS
------------------------------------- x 100
Estimated EPS

Why is it Important?

Earnings surprises can have a huge impact on a company's stock price. Several studies suggest that positive earnings surprises not only lead to an immediate hike in a stock's price, but also to a gradual increase over time. Hence, it's not surprising that some companies are known for routinely beating earning projections. A negative earnings surprise will usually result in a decline in share price.

Next Day Price Change (%)

Next Regular trading session Closing price following Earnings result.

For After Market Close Earnings, It is a next trading day closing price. For Before Market Open Earnings, It is the same trading day closing price.

Why is it Important?

Next Day price change is a reaction of Earnings result.

Ulta Beauty Earnings Beat Masks a Stock Searching for Direction

Posted on Jun 04, 2026 by Chris Markoch

Ulta Beauty Earnings Beat Masks a Stock Searching for Direction

Ulta Beauty (NASDAQ: ULTA) posted a genuinely strong first quarter of fiscal 2026. The market sold it off anyway. Shares of the beauty retail giant fell nearly 5% following the fiscal year 2027 Q1 earnings report, closing at $471.21, despite results that beat on nearly every meaningful metric.

  • Net sales grew 11.1% year-over-year to $3.2 billion.
  • Comparable sales accelerated to +5.3% versus a +2.9% comp in the prior year period.
  • Diluted EPS climbed 15.5% to $7.74.
  • Operating income rose 11.6% to $448.3 million.
  • Gross margin expanded 100 basis points to 40.1%, driven by lower inventory shrink and improved merchandise margins.

The official explanation for the sell-off centered on multi-year guidance that left some investors wanting more. Management held net sales growth guidance flat at +6% to +7% and kept comparable sales guidance unchanged at +2.5% to +3.5%. The company did nudge full-year EPS guidance slightly higher — to $28.36–$28.80, implying 10.6% to 12.3% growth — but not enough to satisfy a market that had perhaps priced in a more aggressive raise.

The more honest read, though, may be simpler: the stock needed a reason to move, and a solid-but-steady print wasn’t it.

ULTA Chart Tells a Complicated Story


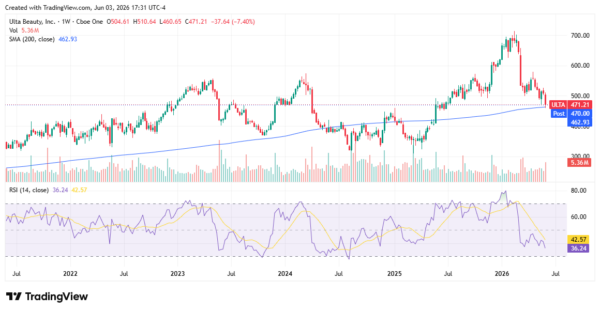
Look at the five-year weekly chart, and a clear picture emerges. Ulta spent most of 2022 through mid-2025 trading in a well-established range between roughly $400 and $550, punctuated by brief excursions in either direction. The run to over $600 in late 2025 and early 2026 stands out as the anomaly — a momentum-fueled extension above the long-term trend that has since been unwinding in orderly fashion.

The stock is now trading just above its 200-week moving average near $462, and the RSI on the weekly chart has dropped to 36, approaching oversold territory not seen since the 2022 drawdown. That combination — mean reversion from an extended high, a return to a well-established long-term support zone, and a momentum indicator nearing a washout — is the kind of technical setup that tends to attract contrarian buyers.

A recovery toward the $550 area, which represented the upper bound of Ulta’s multi-year range before the late-2025 breakout, would represent a gain of roughly 17% from current levels. That is a meaningful return for a company growing earnings in the double digits, with a loyalty program of nearly 47 million members and broad-based category growth — fragrance in the high teens, haircare in the high single digits, and every other category positive in Q1.

ulta - StockEarnings

The Ulta Unleashed Strategy: More Than a Catchy Name

Ulta’s “Ulta Beauty Unleashed” strategic framework is organized around three pillars: driving core business growth, scaling new accretive businesses, and aligning its operational foundation. Q1 showed real progress across all three.

On the core business, the company hosted more than 40,000 in-store events and launched its TikTok Shop, a move that positions it to reach younger consumers in the discovery-driven commerce environment where beauty spending increasingly originates. More than 20 new brands were added in the quarter, and the loyalty program grew 4% year-over-year to approximately 46.9 million members — a competitive moat that remains one of the most underappreciated assets in retail.

On new businesses, the international expansion is quietly gaining traction, with new store openings in Mexico City and Dubai. The company’s digital marketplace now carries 325+ brands and more than 8,000 SKUs. UB Media, its retail media network, continues to scale. These businesses are early-stage but represent genuine optionality that is not yet reflected in earnings models. The company also debuted “Ask Ulta AI,” a beta product that offers personalized recommendations — a small but telling sign that management is investing in the next generation of the customer relationship, not just defending the current one.

Approaching a Level Worth Watching

From a purely technical standpoint, ULTA is at an interesting juncture. The stock is trading just above its 200-week moving average, a level that has historically marked meaningful bottoms during prior corrections. The weekly RSI at 36.24 is approaching, but has not yet reached, the oversold threshold that has historically preceded recoveries. Volume on the post-earnings decline — 5.36 million shares on the weekly bar — was elevated but not panicked.

The risk is that the stock tests the $440–$450 zone before finding a sustainable floor. The reward, if the 200-week holds, is a base-building setup with a clear path back toward $520–$550.

Why the Bulls May Still Have the Better Argument

At roughly 18x forward earnings on guidance of $28.36–$28.80 per share, Ulta is not expensively valued for a company with its profile. Double-digit EPS growth, a fortress loyalty program, expanding gross margins, and $555 million returned to shareholders through buybacks in a single quarter — these are the metrics of a mature compounder, not a broken story.

The buyback program in particular deserves attention. With the share count shrinking and the company generating $262 million in operating cash flow in Q1 alone, the math on per-share earnings growth is structurally supportive. Analysts who cover the stock have price targets meaningfully above current levels, and the valuation compression of the past several months has actually improved the risk/reward rather than impaired it. For a long-term investor willing to look past a quarter of uninspiring guidance, the setup is arguably more compelling now than it was when the stock was trading above $600.

The Bear Case: Consumer Risk Is Real, If Unlikely to Be Fatal

The counterargument to all of this is the consumer. Beauty spending, while historically more resilient than discretionary categories, is not immune to an economic downturn. If tariffs translate into higher prices, or if employment begins to soften, the question of whether consumers continue to trade up within Ulta’s assortment — or simply spend less — becomes relevant.

SG&A expenses rose 14.6% in Q1, driven in part by Space NK integration costs and Unleashed strategy investments. That means margin protection becomes harder if the top line disappoints.

It is worth noting, though, that this is an asymmetric risk rather than a base case. Beauty has proven remarkably sticky through prior recessions — often described as a “lipstick effect” category — and Ulta’s position across both mass and prestige segments gives it a natural hedge. The bear case requires a meaningful consumer pullback to materially impair the thesis. A soft landing — even a bumpy one — probably leaves Ulta’s earnings power largely intact.

Is Ulta’s Post-Earnings Pullback a Buying Opportunity?

Ulta Beauty’s Q1 fiscal 2026 results were, by most reasonable measures, a good quarter. The sell-off that followed says more about where the stock had been than where the business is going. The $600 high was the outlier; the current level near $470 is closer to fair, with a credible path toward $550 and beyond if the business continues to execute. The loyalty ecosystem is deep, the category is resilient, and the valuation is no longer stretched. For investors who can tolerate some near-term volatility while the chart works through its correction, the beauty may be in the buying.

A former marketing copywriter turned freelance financial writer and market analyst. I have a passion for delivering insights to investors. I write regularly about stocks for StockEarnings and MarketBeat. Posts are not advice.

Join over 1.2M+ investors/traders who receive daily and weekly notable earnings alerts with predicted move