ajax loader

Loading...


Ride-the-Wave Strategy – Best for Stock Traders

Ride-the-Wave targets multi-day price momentum following a company’s earnings announcement (EA). With this strategy:

  1. Buy a stock one day post-EA if a stock reacts positively post-earnings:
    1. Near the close of trading the EA-day for a pre-market-EA
    2. Near the close of the following day for a post-market-EA
  2. Sell-to-close after 7-10 days, or possibly earlier if a desired price target is reached

Similarly,

  1. short a stock one day post-EA if a stock reacts negatively post-earnings:
    1. near the close of trading the EA-day for a premarket-EA
    2. near the close of the following day for a post-market-EA
  2. then buy-to-close after 7-10 days, or possibly earlier if a desired price target is reached

Important: Ride-the-Wave is predicated on significant price momentum triggered by an EA. The 7-10 day scenario is the maximum trade hold-time. If you see post EA-momentum is halted or reversed by a significant opposite move, re-evaluate your presence in the trade.

This popular StockEarnings screen below will give you a list of stocks that historically exhibit significant price momentum following an EA for the next seven days:

  1. Stocks exhibiting positive post-EA price moves are buy-candidates
  2. Stocks exhibiting negative post-EA price moves are sell/short-candidates

The screen includes those stocks whose Earnings just came out in last two days.

Screen criteria:

  1. Earnings Date Start Date : Current Date + -1 Day
  2. Earnings Date End Date : Current Date + -2 Days
  3. Predicted Move (Next Day) Max : 7%
  4. Predicted Move (On 7th Day) Min : 7%

Strategy Guideline:

  1. Buy the stock if stock has reacted positively. Short the stock if stock has reacted negatively (see above).
  2. Close the position in 7-10 days, or possibly earlier based on price move.

Volatility Crush Strategy - Best for Options Traders

The Volatility Crush strategy is used with stocks that typically experience relatively low-to-moderate price moves (≤4%) following their Earnings Announcements (EA). The basic trade idea is to sell put or call options right before the EA, collecting a credit when options premium is very high due to elevated implied volatility (IV). You then close the position right after the EA by buying the option back much cheaper due to the significant drop in IV that occurs after the mystery of the EA disappears. In assessing this trade, you need to do your homework to ensure you collect sufficient premium to make the trade worthwhile.

This trade is practical due to the low-to-moderate price-move after the EA, which generally won’t significantly affect the options price, unlike an “action” stock, which experience great price moves post-EA. With these symbols, if you’re on the right side of the price move, that’s a great thing. But if you’re on the wrong side of the move, not so great. Consequently, by minimizing the effect of the post-EA price move, you have a much better chance to profit from the reduction in IV without it being ruined by a violent price move.

For this trade, open the position either (1) the night before the EA when the company announces earnings or (2) during the EA day when it announces post-market, generally capturing IV at or close to its peak.

For this trade, open the position either (1) the night before the EA when the company announces earnings or (2) during the EA day when it announces post-market, generally capturing IV at or close to its peak.

This popular stockearnings screen will give you a list of stocks which do not react more than 4% fpost-EA. It includes only those stocks whose earnings are releasing next day.

Screen criteria:

  1. Earnings Date Start Date : Current Date + 1
  2. Earnings Date End Date : Current Date + 1
  3. Predicted Move (Next Day) Max : 4%
  4. Options Type: Weekly

Strategy Guideline:

  1. Options Strategy: Sell Call and Put
  2. Options Strike Price: Current Stock Price – (% Predicated Move x 2)
  3. Expiration Date: It should generally be the closest expiry immediately after the EA.
  4. Buy Insurance: Buying back Call and Put at Strike price which 10% lower than Sell Strike Price is optional but recommended.

Watch Video for More Detail

Volatility Rush Strategy - Best for Options Traders

The Volatility Rush takes advantage of increasing options premiums into earnings announcements (EA) caused by an anticipated rise in Implied Volatility (IV). With this strategy, Buy a Call and Put at-the-money (a long straddle) 2-3 weeks before the EA when IV is lower. Sell the position either (1) the night before the EA when the company announces earnings pre-market, or (2) during the EA day when it announces post-market, generally capturing IV at or close to its peak.

This popular screen will give you a list of stocks whose Options premiums tend to rise into Earnings. It includes only those stocks whose Earnings are at least two weeks away from today.

Screen criteria:

  1. Earnings Date Start Date : Current Date + 15 Days
  2. Earnings Date End Date : Current Date + 30 Days
  3. Predicted Move (Next Day) Min : 5%
  4. Options Type: Weekly or Monthly if that lines up with the two to three-week lead-time for entering the trade

Strategy Guideline:

  1. Buy a Straddle at or close to the money two to three weeks pre-EA.
  2. Sell the position either the night before the EA when the company announces earnings pre-market, or during the EA day when it announces post-market.
  3. Expiration date should generally be the closest expiry immediately after the EA.
  4. Straddle price should not be more 60% of predicted move.

Predicted Move (Volatility)

Similar to Implied Volatility in Options. Expected volatility % based on our Proprietary Volatility Predication Model. We are expecting that stock price will likely to reach % in either direction by the end of next trading session after Earnings are released and not necessarily the closing volatility %.

Why is it important?

    This indicator helps

  1. Knowing expected volatility in stocks after Earnings helps to decide trading stocks before Earnings Announcement.
  2. Taking Advantage of volatility collapse following Earnings Results by using Advance Options strategies such as Spread and Straddles.

Since Last Earnings

Change in share price since last Earnings release.

Why is it Important?

When share has gained more than 10% since it's last Earning release, it tends to over react to minor bad news and give up some gains if not all. So, it contains more downside volatility than upside When share has dropped more than 10% since it's last Earning release, it tends to over react to minor good news and recover some drops if not all. So, it contains more upside volatility than downside.

EPS Surprise (%)

Occurs when a company's reported quarterly or annual profits are above or below analysts' expectations. Here is the formula to derive % EPS Surprice:

Actual EPS - Estimated EPS
------------------------------------- x 100
Estimated EPS

Why is it Important?

Earnings surprises can have a huge impact on a company's stock price. Several studies suggest that positive earnings surprises not only lead to an immediate hike in a stock's price, but also to a gradual increase over time. Hence, it's not surprising that some companies are known for routinely beating earning projections. A negative earnings surprise will usually result in a decline in share price.

Next Day Price Change (%)

Next Regular trading session Closing price following Earnings result.

For After Market Close Earnings, It is a next trading day closing price. For Before Market Open Earnings, It is the same trading day closing price.

Why is it Important?

Next Day price change is a reaction of Earnings result.

Weakness is an Opportunity for Broadcom

Posted on Jun 04, 2026 by Ian Cooper

Weakness is an Opportunity for Broadcom

Weakness may be an attractive opportunity for Broadcom (NASDAQ: AVGO). While the semiconductor giant recently delivered another quarter of record-breaking financial results, the stock has pulled back roughly 13%, creating what some analysts believe could be an appealing entry point for long-term investors. The decline comes despite strong fundamentals and continued confidence in the company’s long-term growth prospects, particularly in the rapidly expanding artificial intelligence market.

For its most recent quarter, Broadcom reported revenue of $22.2 billion, slightly ahead of Wall Street expectations of $22.1 billion. Earnings per share came in at $2.44, topping analyst estimates of $2.39. 

However, despite the strong quarterly performance, investors focused on the company’s forward guidance – especially after CEO Hock Tan chose not to raise the company’s long-term AI revenue outlook. Instead, he reiterated Broadcom’s expectation that AI-related revenue could exceed $100 billion by fiscal 2027. While some investors were hoping for a more aggressive forecast, the existing target remains highly impressive and reflects the company’s confidence in the ongoing buildout of AI infrastructure worldwide.

Analysts See Significant Upside After the Decline


Several Wall Street firms continue to express strong confidence in Broadcom’s future growth trajectory. Among them is Goldman Sachs, which recently reiterated its buy rating and maintained a price target of $525 per share.

Goldman Sachs stated that it would be an aggressive buyer of the stock following the recent pullback. The firm emphasized that Broadcom continues to present a compelling long-term growth story, supported by substantial opportunities in AI semiconductors and custom silicon solutions. 

Goldman also highlighted several reasons for its optimism. First, the firm noted that Broadcom still expects fiscal 2027 AI semiconductor revenue to significantly exceed $100 billion, supported by approximately 10 gigawatts of data center deployments. This projection underscores the magnitude of AI investment taking place across the technology industry and Broadcom’s central role in supplying critical infrastructure.

Morgan Stanley recently reiterated its overweight rating on Broadcom and maintained a price target of $502. The firm continues to view the company as one of the strongest beneficiaries of AI-related capital spending and believes long-term demand trends remain intact despite short-term market volatility.

Meanwhile, analysts at Bernstein acknowledged that AI revenue can be somewhat “lumpy” from quarter to quarter. However, they also pointed out that Broadcom’s projected AI growth remains extraordinary. The company expects AI-related revenue to increase roughly 200% year over year in the upcoming quarter, while its long-term revenue targets continue to reflect substantial demand from hyperscale customers and large-scale data center deployments.

Pullback Tests Key Support Levels

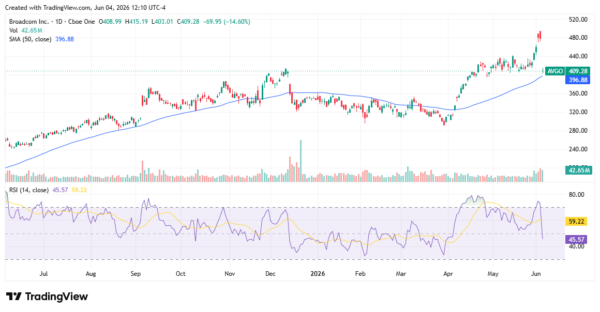
Broadcom shares experienced a sharp post-earnings decline, falling from recent highs near $485 to around $409. While the move looks dramatic, the stock remains above its rising 50-day simple moving average near $397, a level that often serves as support during healthy uptrends.

The recent selloff also pushed the Relative Strength Index (RSI) down to approximately 46, a significant reset from overbought readings above 70 seen in May. That suggests much of the near-term excess optimism has been worked out of the stock.

For bullish investors, the $395-$400 area is an important support zone to monitor. If shares stabilize above that level, the longer-term uptrend remains intact. Resistance now sits near $440, followed by the recent highs around $485. A recovery through those levels could signal renewed momentum as investors refocus on Broadcom’s AI-driven growth story.

broadcom - StockEarnings

Why Broadcom Remains an Attractive AI Investment

That’s again creating a solid long-term opportunity. Plus, while we wait for the stock to recover lost ground, we can collect its recently declared dividend of 65 cents per share. That’s payable on June 30 to shareholders of record as of June 22.

That follows a cash dividend of 65 cents per share paid on March 31.

In short, for investors willing to look beyond short-term market reactions, the recent weakness could represent an attractive buying opportunity. With AI spending expected to remain a powerful secular growth trend for years to come, Broadcom remains one of the most compelling ways to gain exposure to the next phase of the artificial intelligence revolution.

Over the last 26 years, he’s taught thousands of investors how to trade news flow and herd mentality using a unique blend of technical and fundamental analysis. Cooper was among the few analysts to spot the financial crisis of 2008, the top of subprime and Alt-A, the death of Lehman Brothers, Bear Stearns, and New Century Financial, and even the Dow’s collapse to 6,500, as well as its recovery. He even called for gold to rally well above $1.500 when it traded under $600. At the moment, Cooper makes use of technical, fundamental and news analysis, to help individual investors grow their wealth. He’s a firm believer that hard work and thorough research will lead to investment success.

Join over 1.2M+ investors/traders who receive daily and weekly notable earnings alerts with predicted move