ajax loader

Loading...


Ride-the-Wave Strategy – Best for Stock Traders

Ride-the-Wave targets multi-day price momentum following a company’s earnings announcement (EA). With this strategy:

  1. Buy a stock one day post-EA if a stock reacts positively post-earnings:
    1. Near the close of trading the EA-day for a pre-market-EA
    2. Near the close of the following day for a post-market-EA
  2. Sell-to-close after 7-10 days, or possibly earlier if a desired price target is reached

Similarly,

  1. short a stock one day post-EA if a stock reacts negatively post-earnings:
    1. near the close of trading the EA-day for a premarket-EA
    2. near the close of the following day for a post-market-EA
  2. then buy-to-close after 7-10 days, or possibly earlier if a desired price target is reached

Important: Ride-the-Wave is predicated on significant price momentum triggered by an EA. The 7-10 day scenario is the maximum trade hold-time. If you see post EA-momentum is halted or reversed by a significant opposite move, re-evaluate your presence in the trade.

This popular StockEarnings screen below will give you a list of stocks that historically exhibit significant price momentum following an EA for the next seven days:

  1. Stocks exhibiting positive post-EA price moves are buy-candidates
  2. Stocks exhibiting negative post-EA price moves are sell/short-candidates

The screen includes those stocks whose Earnings just came out in last two days.

Screen criteria:

  1. Earnings Date Start Date : Current Date + -1 Day
  2. Earnings Date End Date : Current Date + -2 Days
  3. Predicted Move (Next Day) Max : 7%
  4. Predicted Move (On 7th Day) Min : 7%

Strategy Guideline:

  1. Buy the stock if stock has reacted positively. Short the stock if stock has reacted negatively (see above).
  2. Close the position in 7-10 days, or possibly earlier based on price move.

Volatility Crush Strategy - Best for Options Traders

The Volatility Crush strategy is used with stocks that typically experience relatively low-to-moderate price moves (≤4%) following their Earnings Announcements (EA). The basic trade idea is to sell put or call options right before the EA, collecting a credit when options premium is very high due to elevated implied volatility (IV). You then close the position right after the EA by buying the option back much cheaper due to the significant drop in IV that occurs after the mystery of the EA disappears. In assessing this trade, you need to do your homework to ensure you collect sufficient premium to make the trade worthwhile.

This trade is practical due to the low-to-moderate price-move after the EA, which generally won’t significantly affect the options price, unlike an “action” stock, which experience great price moves post-EA. With these symbols, if you’re on the right side of the price move, that’s a great thing. But if you’re on the wrong side of the move, not so great. Consequently, by minimizing the effect of the post-EA price move, you have a much better chance to profit from the reduction in IV without it being ruined by a violent price move.

For this trade, open the position either (1) the night before the EA when the company announces earnings or (2) during the EA day when it announces post-market, generally capturing IV at or close to its peak.

For this trade, open the position either (1) the night before the EA when the company announces earnings or (2) during the EA day when it announces post-market, generally capturing IV at or close to its peak.

This popular stockearnings screen will give you a list of stocks which do not react more than 4% fpost-EA. It includes only those stocks whose earnings are releasing next day.

Screen criteria:

  1. Earnings Date Start Date : Current Date + 1
  2. Earnings Date End Date : Current Date + 1
  3. Predicted Move (Next Day) Max : 4%
  4. Options Type: Weekly

Strategy Guideline:

  1. Options Strategy: Sell Call and Put
  2. Options Strike Price: Current Stock Price – (% Predicated Move x 2)
  3. Expiration Date: It should generally be the closest expiry immediately after the EA.
  4. Buy Insurance: Buying back Call and Put at Strike price which 10% lower than Sell Strike Price is optional but recommended.

Watch Video for More Detail

Volatility Rush Strategy - Best for Options Traders

The Volatility Rush takes advantage of increasing options premiums into earnings announcements (EA) caused by an anticipated rise in Implied Volatility (IV). With this strategy, Buy a Call and Put at-the-money (a long straddle) 2-3 weeks before the EA when IV is lower. Sell the position either (1) the night before the EA when the company announces earnings pre-market, or (2) during the EA day when it announces post-market, generally capturing IV at or close to its peak.

This popular screen will give you a list of stocks whose Options premiums tend to rise into Earnings. It includes only those stocks whose Earnings are at least two weeks away from today.

Screen criteria:

  1. Earnings Date Start Date : Current Date + 15 Days
  2. Earnings Date End Date : Current Date + 30 Days
  3. Predicted Move (Next Day) Min : 5%
  4. Options Type: Weekly or Monthly if that lines up with the two to three-week lead-time for entering the trade

Strategy Guideline:

  1. Buy a Straddle at or close to the money two to three weeks pre-EA.
  2. Sell the position either the night before the EA when the company announces earnings pre-market, or during the EA day when it announces post-market.
  3. Expiration date should generally be the closest expiry immediately after the EA.
  4. Straddle price should not be more 60% of predicted move.

Predicted Move (Volatility)

Similar to Implied Volatility in Options. Expected volatility % based on our Proprietary Volatility Predication Model. We are expecting that stock price will likely to reach % in either direction by the end of next trading session after Earnings are released and not necessarily the closing volatility %.

Why is it important?

    This indicator helps

  1. Knowing expected volatility in stocks after Earnings helps to decide trading stocks before Earnings Announcement.
  2. Taking Advantage of volatility collapse following Earnings Results by using Advance Options strategies such as Spread and Straddles.

Since Last Earnings

Change in share price since last Earnings release.

Why is it Important?

When share has gained more than 10% since it's last Earning release, it tends to over react to minor bad news and give up some gains if not all. So, it contains more downside volatility than upside When share has dropped more than 10% since it's last Earning release, it tends to over react to minor good news and recover some drops if not all. So, it contains more upside volatility than downside.

EPS Surprise (%)

Occurs when a company's reported quarterly or annual profits are above or below analysts' expectations. Here is the formula to derive % EPS Surprice:

Actual EPS - Estimated EPS
------------------------------------- x 100
Estimated EPS

Why is it Important?

Earnings surprises can have a huge impact on a company's stock price. Several studies suggest that positive earnings surprises not only lead to an immediate hike in a stock's price, but also to a gradual increase over time. Hence, it's not surprising that some companies are known for routinely beating earning projections. A negative earnings surprise will usually result in a decline in share price.

Next Day Price Change (%)

Next Regular trading session Closing price following Earnings result.

For After Market Close Earnings, It is a next trading day closing price. For Before Market Open Earnings, It is the same trading day closing price.

Why is it Important?

Next Day price change is a reaction of Earnings result.

Impatient Investors Overrides Ciena’s Q2 Solid Earnings Results

Posted on Jun 05, 2026 by Grayson Cavern

Impatient Investors Overrides Ciena’s Q2 Solid Earnings Results

During the California Gold Rush, finding gold wasn’t the hardest part. Building the railroads needed to reach it was. Ciena Corp (NYSE: CIEN)‘s Q2 2026 earnings report just exposed a tension that maps almost perfectly onto that dynamic – a business delivering extraordinary results inside an opportunity the market had already decided to price as if it were further along than it actually is.

Revenue surged 40% year-over-year to $1.57 billion. Adjusted EPS climbed 290% to $1.64. Gross margin expanded to 44.9%. Management raised full-year revenue guidance to roughly $6.3 billion. 

By almost any conventional measure, this was the quarter investors wanted from a major beneficiary of the AI infrastructure buildout. Then the stock fell anyway – and that reaction is worth scrutinizing, because it has nothing to do with the business and everything to do with the clock.

Demand Is A Foregone Conclusion


Ciena Corp’s quarter 2 report becomes much easier to understand once we stop looking at the stock and start looking at the business, because the business itself gave investors very little reason to worry.

Revenue increased 39.5% year over year to $1.57 billion. Optical Networking, Ciena’s largest segment, generated $1.1 billion in revenue, up 42% from a year ago. Routing and Switching revenue surged 88% to $174 million. Together, those businesses accounted for more than 80% of total company revenue.

Cloud providers continued expanding their contribution as well, representing nearly half of total revenue during the quarter. These are the very customers building the infrastructure needed to support artificial intelligence are spending heavily on the networking equipment sitting underneath that buildout. If demand were slowing, this is where it would show up first.

Instead, the opposite happened.

The strongest parts of the business became even stronger. And that’s where the first bearish explanation begins to fall apart as weak demand would have shown up in customer spending, segment growth, and most obviously, in revenue. But it showed up nowhere.

Which leaves us with the question of profitability. 

A Quarter With No Weakness Or Bearish Case

Revenue growth attracts attention, but profit growth is what compounds wealth, and Ciena delivered both in a combination that doesn’t appear in most earnings reports at this stage of a growth cycle. Gross profit increased 53% to nearly $692 million, outpacing revenue growth by a meaningful margin. Adjusted gross margin expanded from 41.0% to 44.9%. Adjusted operating expenses, meanwhile, increased just 7.7% against nearly 40% revenue growth, and that gap between the two is where the real story lives.

Adjusted operating margin expanded from 8.2% to 19.5%. Operating income surged from $33 million to $238 million. Adjusted EBITDA jumped 193% to $342 million. Net income climbed from $9 million a year ago to more than $218 million. Revenue rose 40% and operating income rose more than 600%. Indicating that operating leverage arrived at scale after years of investment, and it is the kind of financial inflection that typically precedes a sustained re-rating rather than a selloff. 

Operating cash flow increased 87% to $487 million across the first six months of the fiscal year, inventory declined, deferred revenue increased, and the balance sheet held roughly $1.4 billion in cash and investments.

Bottomline is, the deeper you go into this quarter, the harder it becomes to find a meaningful weakness or bearish thesis in the operating results – which makes the market’s reaction the most interesting part of the entire report. 

Another Company Falls Victim To The Wrong Metric

The answer to why the stock fell despite exceptional results lies in something investors rarely discuss with the precision it deserves: time. You see, the management spent the quarter discussing deployment schedules, customer readiness, execution complexity, and the long-term arc of an infrastructure buildout still unfolding across multiple years. 

However, the market was focused on a different metric entirely, that is: how fast the opportunity converts into the earnings trajectory that had already been priced into the stock.

Normally, infrastructure projects move in years. And stock prices move in expectations. But when those two timelines diverge, even exceptional quarters can read as disappointments to a market that has positioned itself ahead of the delivery curve. Ciena confirmed that demand exists, that customers are spending, and that the company can convert that spending into extraordinary profitability. 

What it didn’t confirm was that the full scale of the opportunity would arrive quickly enough to satisfy investors who had already run far ahead of the buildout itself.

Wall Street Ran Ahead Of The Buildout

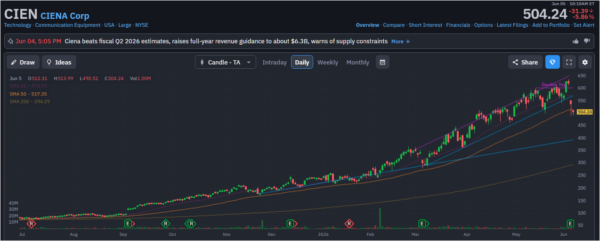
By the time Ciena reported earnings, shares had already climbed from roughly $230 at the start of the year to more than $620, a gain of nearly 170% in less than six months. A move of that magnitude is a reflection of the fact that investors were convinced the future is arriving faster than everyone else realizes.

Wednesday’s reaction suggests that conviction finally met resistance.

More than 7.6 million shares traded as the stock sliced below its 20-day moving average near $572. Yet the bigger picture barely changed. Shares remain above the 50-day moving average around $516 and nowhere near the 200-day moving average near $292.

Institutions didn’t abandon this position. They trimmed it. The selloff challenged the speed of the opportunity, not the destination, and that distinction matters enormously for how you think about what comes next. 

Ciena-StockEarnings

What Comes Next?

Ciena’s results confirmed everything that matters about the long-term thesis. The demand is real, profitability is inflecting, and the customers funding the AI infrastructure buildout are spending heavily on exactly what Ciena builds. The only thing the quarter didn’t deliver was permission for the market to move even further ahead of the business than it already had. 

Meaning, time is the only thing standing between Ciena and the future Wall Street already tried to buy at $620

Join over 1.2M+ investors/traders who receive daily and weekly notable earnings alerts with predicted move