ajax loader

Loading...


Ride-the-Wave Strategy – Best for Stock Traders

Ride-the-Wave targets multi-day price momentum following a company’s earnings announcement (EA). With this strategy:

  1. Buy a stock one day post-EA if a stock reacts positively post-earnings:
    1. Near the close of trading the EA-day for a pre-market-EA
    2. Near the close of the following day for a post-market-EA
  2. Sell-to-close after 7-10 days, or possibly earlier if a desired price target is reached

Similarly,

  1. short a stock one day post-EA if a stock reacts negatively post-earnings:
    1. near the close of trading the EA-day for a premarket-EA
    2. near the close of the following day for a post-market-EA
  2. then buy-to-close after 7-10 days, or possibly earlier if a desired price target is reached

Important: Ride-the-Wave is predicated on significant price momentum triggered by an EA. The 7-10 day scenario is the maximum trade hold-time. If you see post EA-momentum is halted or reversed by a significant opposite move, re-evaluate your presence in the trade.

This popular StockEarnings screen below will give you a list of stocks that historically exhibit significant price momentum following an EA for the next seven days:

  1. Stocks exhibiting positive post-EA price moves are buy-candidates
  2. Stocks exhibiting negative post-EA price moves are sell/short-candidates

The screen includes those stocks whose Earnings just came out in last two days.

Screen criteria:

  1. Earnings Date Start Date : Current Date + -1 Day
  2. Earnings Date End Date : Current Date + -2 Days
  3. Predicted Move (Next Day) Max : 7%
  4. Predicted Move (On 7th Day) Min : 7%

Strategy Guideline:

  1. Buy the stock if stock has reacted positively. Short the stock if stock has reacted negatively (see above).
  2. Close the position in 7-10 days, or possibly earlier based on price move.

Volatility Crush Strategy - Best for Options Traders

The Volatility Crush strategy is used with stocks that typically experience relatively low-to-moderate price moves (≤4%) following their Earnings Announcements (EA). The basic trade idea is to sell put or call options right before the EA, collecting a credit when options premium is very high due to elevated implied volatility (IV). You then close the position right after the EA by buying the option back much cheaper due to the significant drop in IV that occurs after the mystery of the EA disappears. In assessing this trade, you need to do your homework to ensure you collect sufficient premium to make the trade worthwhile.

This trade is practical due to the low-to-moderate price-move after the EA, which generally won’t significantly affect the options price, unlike an “action” stock, which experience great price moves post-EA. With these symbols, if you’re on the right side of the price move, that’s a great thing. But if you’re on the wrong side of the move, not so great. Consequently, by minimizing the effect of the post-EA price move, you have a much better chance to profit from the reduction in IV without it being ruined by a violent price move.

For this trade, open the position either (1) the night before the EA when the company announces earnings or (2) during the EA day when it announces post-market, generally capturing IV at or close to its peak.

For this trade, open the position either (1) the night before the EA when the company announces earnings or (2) during the EA day when it announces post-market, generally capturing IV at or close to its peak.

This popular stockearnings screen will give you a list of stocks which do not react more than 4% fpost-EA. It includes only those stocks whose earnings are releasing next day.

Screen criteria:

  1. Earnings Date Start Date : Current Date + 1
  2. Earnings Date End Date : Current Date + 1
  3. Predicted Move (Next Day) Max : 4%
  4. Options Type: Weekly

Strategy Guideline:

  1. Options Strategy: Sell Call and Put
  2. Options Strike Price: Current Stock Price – (% Predicated Move x 2)
  3. Expiration Date: It should generally be the closest expiry immediately after the EA.
  4. Buy Insurance: Buying back Call and Put at Strike price which 10% lower than Sell Strike Price is optional but recommended.

Watch Video for More Detail

Volatility Rush Strategy - Best for Options Traders

The Volatility Rush takes advantage of increasing options premiums into earnings announcements (EA) caused by an anticipated rise in Implied Volatility (IV). With this strategy, Buy a Call and Put at-the-money (a long straddle) 2-3 weeks before the EA when IV is lower. Sell the position either (1) the night before the EA when the company announces earnings pre-market, or (2) during the EA day when it announces post-market, generally capturing IV at or close to its peak.

This popular screen will give you a list of stocks whose Options premiums tend to rise into Earnings. It includes only those stocks whose Earnings are at least two weeks away from today.

Screen criteria:

  1. Earnings Date Start Date : Current Date + 15 Days
  2. Earnings Date End Date : Current Date + 30 Days
  3. Predicted Move (Next Day) Min : 5%
  4. Options Type: Weekly or Monthly if that lines up with the two to three-week lead-time for entering the trade

Strategy Guideline:

  1. Buy a Straddle at or close to the money two to three weeks pre-EA.
  2. Sell the position either the night before the EA when the company announces earnings pre-market, or during the EA day when it announces post-market.
  3. Expiration date should generally be the closest expiry immediately after the EA.
  4. Straddle price should not be more 60% of predicted move.

Predicted Move (Volatility)

Similar to Implied Volatility in Options. Expected volatility % based on our Proprietary Volatility Predication Model. We are expecting that stock price will likely to reach % in either direction by the end of next trading session after Earnings are released and not necessarily the closing volatility %.

Why is it important?

    This indicator helps

  1. Knowing expected volatility in stocks after Earnings helps to decide trading stocks before Earnings Announcement.
  2. Taking Advantage of volatility collapse following Earnings Results by using Advance Options strategies such as Spread and Straddles.

Since Last Earnings

Change in share price since last Earnings release.

Why is it Important?

When share has gained more than 10% since it's last Earning release, it tends to over react to minor bad news and give up some gains if not all. So, it contains more downside volatility than upside When share has dropped more than 10% since it's last Earning release, it tends to over react to minor good news and recover some drops if not all. So, it contains more upside volatility than downside.

EPS Surprise (%)

Occurs when a company's reported quarterly or annual profits are above or below analysts' expectations. Here is the formula to derive % EPS Surprice:

Actual EPS - Estimated EPS
------------------------------------- x 100
Estimated EPS

Why is it Important?

Earnings surprises can have a huge impact on a company's stock price. Several studies suggest that positive earnings surprises not only lead to an immediate hike in a stock's price, but also to a gradual increase over time. Hence, it's not surprising that some companies are known for routinely beating earning projections. A negative earnings surprise will usually result in a decline in share price.

Next Day Price Change (%)

Next Regular trading session Closing price following Earnings result.

For After Market Close Earnings, It is a next trading day closing price. For Before Market Open Earnings, It is the same trading day closing price.

Why is it Important?

Next Day price change is a reaction of Earnings result.

Lucid Stock Crashes 41% on Bankruptcy Rumors: What’s Next

Posted on Jul 15, 2026 by Chris Markoch

Lucid Stock Crashes 41% on Bankruptcy Rumors: What’s Next

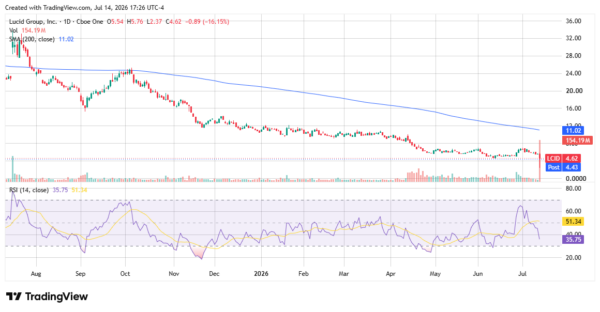
Lucid Group (NASDAQ: LCID) just had its worst trading day on record. Shares fell more than 50% intraday on Tuesday, briefly touching $2.37, before clawing back to close down roughly 15-16% near $4.62. The trigger: a report claiming the EV maker had hired restructuring firm AlixPartners to weigh either a Chapter 11 filing or a take-private deal.

Lucid pushed back hard. Chief Communications Officer Nick Twork called the rumors “completely false” and said AlixPartners has not recommended bankruptcy to management or the board. He reiterated that the company has sufficient liquidity to operate well into next year. Both statements are technically accurate. Neither one addresses the deeper problem.

A Denial That Doesn’t Change the Math


Lucid’s cash position isn’t the issue investors should worry about. The company reported roughly $3.2 billion in liquidity at the end of the first quarter, with pro forma liquidity closer to $4.7 billion after an April capital raise led by Saudi Arabia’s Public Investment Fund. That buys time. It doesn’t buy a turnaround.

The bigger question is what changes between now and whenever that liquidity runs dry. The federal $7,500 EV purchase incentive has already expired, and there’s no realistic path for it to return in the next two years. That subsidy was doing real work, propping up demand for a vehicle category that still costs more to build than it sells for. Lucid’s gross margin remains deeply negative, and the company just missed its second-quarter delivery targets after already cutting 18% of its workforce in June.

This is why the “when, not if” framing matters. Bankruptcy isn’t imminent. But the structural tailwinds that might have carried Lucid through a rough patch — subsidies, cheap capital, forgiving investor sentiment toward EV growth stories — have mostly disappeared. Management can extend the runway. It’s much harder to see what shortens the distance to profitability.

Lucid Earnings on Aug. 4: Catalyst Or Crash Confirmation

Lucid reports second-quarter earnings on August 4, and that date now matters more than anything Twork said this week. The company doesn’t need a miracle. It needs to show progress on unit costs, a credible path for the Gravity SUV, and evidence that the smaller, more affordable model line isn’t slipping further to the right. Anything short of that will reopen the same conversation this week’s denial was meant to close.

Investors should also watch for language changes. “Sufficient liquidity into 2027” is a moving target, not a fixed promise, and it will keep shrinking every quarter Lucid keeps burning cash at its current pace.

LCID Stock Chart Signals Continued Selling Pressure

Technically, LCID’s chart is exactly what you’d expect from a company the market thinks is circling the drain: a persistent downtrend, repeated support breaks, and volume spikes on the way down rather than the way up. That’s not a chart pattern that screams “buy the dip.” It’s one that screams distress.
lucid - StockEarnings

The one wrinkle is that the stock is approaching oversold territory on momentum indicators, and short interest remains elevated by most measures. That combination — a stretched short base plus an oversold bounce setup — is the classic recipe for a short squeeze. Traders who like volatility will be watching for it. But a squeeze is a trade, not a thesis. It says nothing about whether Lucid’s business model actually works, and conflating the two is how retail investors get hurt chasing a bounce that has nothing to do with fundamentals.

Lucid Stock Shows Why the EV Market Is Facing a Reality Check

Lucid’s troubles aren’t happening in a vacuum. The broader EV industry spent the last few years assuming demand would keep accelerating on its own, subsidies or not. That bet hasn’t paid off. U.S. consumers have responded by circling back to hybrids in a big way, treating them as the practical middle ground between gas and a fully electric commitment they’re not ready to make.

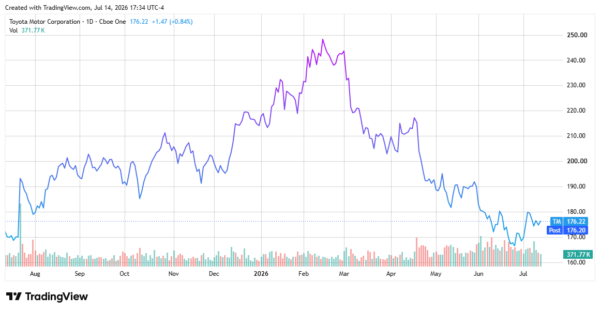
That shift is exactly why Toyota Motor (NYSE: TM) makes such a useful contrast to Lucid right now. Toyota’s numbers aren’t spectacular. The company is forecasting a third straight year of declining operating income, squeezed by tariffs and cost pressure.

But that’s a company managing margins, not one questioning its survival. Toyota’s U.S. sales rose more than 10% in June, with electrified models — mostly hybrids — making up nearly 57% of that volume. Full-year global sales hit a record above 11.3 million vehicles in 2025.

Toyota isn’t firing on all cylinders. Its profit outlook is under pressure, and tariffs are a real drag. But there’s a difference between a company absorbing cyclical headwinds and one burning billions with no clear runway to breakeven. Toyota’s hybrid-first strategy is proving out with actual demand and actual profit, even if that profit is shrinking. Lucid is still trying to prove its core product can be built and sold at a price that makes economic sense.
Lucid - StockEarnings

What’s Next for Lucid Stock After the Bankruptcy Rumors?

Lucid isn’t filing for bankruptcy this week, and the company is right to push back on a report built on anonymous sourcing. But “not bankrupt today” is a low bar, and it’s not the same as “on a path to solvency.”

August 4 will tell investors a lot more than this week’s denial did. Until then, the stock is a trade for people who like volatility, and a warning for anyone mistaking a short squeeze for a recovery.


A former marketing copywriter turned freelance financial writer and market analyst. I have a passion for delivering insights to investors. I write regularly about stocks for StockEarnings and MarketBeat. Posts are not advice.

Join over 1.2M+ investors/traders who receive daily and weekly notable earnings alerts with predicted move