Just about a week ago, I generally cautioned traders about jumping aboard Oracle (NYSE: ORCL). Basically, ORCL stock didn’t deliver enough evidence to suggest that it was a worthwhile bullish opportunity. Yes, it was disappointing to hear because, at the time of publication, ORCL was down 34% in a month. Therefore, the reasonable conclusion was that the security has gone down too far, too fast.
Well, my central criticism was that those who shared that sentiment need to demonstrate why they believe that with data. It can’t just be “trust me bro.” With ORCL stock losing nearly 9% over the trailing five sessions, I’m glad that I issued an opinion that went against popular consensus.
No, I don’t think I’m some market guru. Frankly, that era of self-delusion is long gone. Today, I only look at the hard numbers and base my forecasts on the principle of inference to the best explanation.
What did the data suggest? In my last StockEarnings article covering Oracle, I mentioned that ORCL stock in the past 10 weeks only printed four up weeks, thereby leading to a downward slope. When past empirical data was conditioned for this sequence, the median expected outcome over the next 10 weeks was no better than the random baseline — and in many cases conspicuously worse.
Of course, this analysis didn’t necessarily mean that the current trajectory of ORCL stock had to follow established, conditional patterns. However, the historical reality is that when Oracle flashed the 4-6-D sequence, the odds simply did not incentivize bullish exposure.
Obviously, one example doesn’t grant legitimacy to any model. Nevertheless, I do think it’s significant that the popular assumption was that Oracle stock was too good of an opportunity to suffer a 34% haircut in a month. Yet the data suggested otherwise — and guess what? At this moment, the data proved correct.
One Week Could Make a Big Difference for ORCL Stock
Now, let’s address the follow-up question: what does the data say may happen for Oracle stock next? Even though it’s been only a week, that might make a big difference.
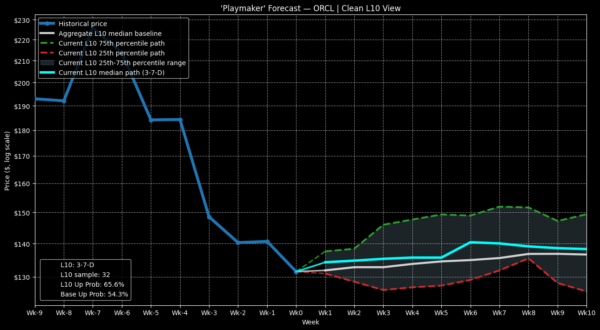
At this hour, ORCL stock is on pace to incur a (sizable) down week. As such, you’re looking at the security flashing a 3-7-D sequence: three up weeks, seven down weeks, with a downward slope overall across the 10-week period. Conditioned for this signal, the implications are more positive for debit-side bullish traders.
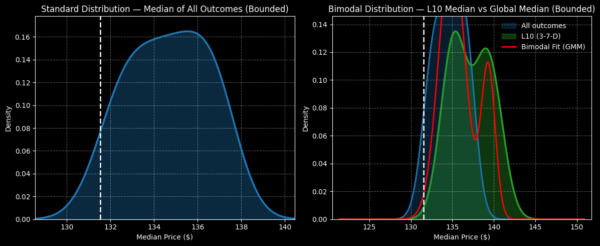
Since January 2019, the aforementioned signal has flashed 32 times. Over the next 10 weeks, the expected median distribution would likely land between $130 and $145 (assuming a starting price of $131.54, Monday’s close), with probability density peaking at an average price of roughly $136.
This is a superior performance relative to the random baseline, where a 10-week long position in ORCL stock (from the same starting price) would be expected to land between $129 and $140, with probability density peaking at $135.50.
Granted, a 0.4% positive variance isn’t much to write home about, even with the leverage of options strategy. Still, it’s important to realize that the elevated performance relative to the baseline isn’t orderly and linear; that is, some weeks within the 10-week distribution are stronger than others.
Specifically, week 6 following the flashing of the 3-7-D signal features the highest median expected value at just above $140. Thus, if we’re trading purely based on the inductive data, the natural play would be to consider the 135/140 bull call spread expiring Aug. 21.
Here, ORCL stock needs to rise through the $140 strike at expiration to be fully profitable, which translates to a maximum payout of over 122%. Further, the net debit per each spread is reasonable at $225. Finally, the expiration date of Aug. 21 (which is a near-expiry date) is chosen deliberately as it cuts off exposure — exposure that could turn a profitable position out of the money.
I should note here that it’s a myth that debit-side options traders should always buy long-dated calls. You’re often paying a substantial premium for that extra time and it’s a constant threat that a profitable position could become unprofitable due to a variety of unexpected market factors.
Oracle Stock Could Potentially Be Favorably Mispriced
Another potentially enticing point about ORCL stock is that the aforementioned 135/140 bull spread could be favorably mispriced. Consider that the breakeven price for this spread is $137.25, where the market has assigned a probability of profit of only 41.8%.
This statistic is derived from a Black-Scholes-based framework, which is constructed as the distance (in standard deviations) the target price is from the current spot price, assuming a risk-neutral, log-normal distribution of outcomes. In simpler terms, the market takes into account the volatility of the specific options chain and calculates the implied probability of the security hitting the target price.
However, my model is explicitly a forecasting framework. It takes past empirical data conditioned to a specific balance of order flow (i.e. how many up/down weeks there are in a given 10-week period) and triangulating a median expected pathway.
To be clear, I’m not saying that one is better than the other as each model is answering different questions. However, the main difference is that we may find alternative expectations using different methodologies — and these variances can potentially uncover an edge.
In the case of Oracle stock, we know that under 3-7-D conditions, the probability that ORCL reaches the breakeven price of $137.25 at the Aug. 21 expiration is 59.4%. You can look this up manually if you so choose. Since January 2019, following 32 instances of the aforementioned signal, ORCL exceeded the breakeven price 19 times.
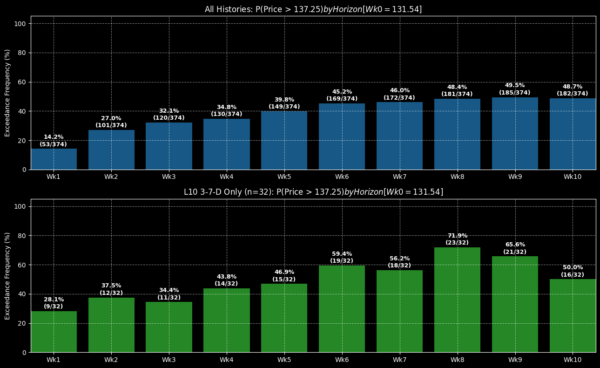
Does this necessarily mean that over the next six weeks, you are certain to enjoy a greater probability of upside success rather than downside failure? No, nothing in the market is guaranteed. But if we were to assume a general stability in the underlying sentiment regime, then the data does suggest that ORCL stock is more likely to hit the breakeven price than to fall below it.
While my model may be difficult to accept at face value, please consider what I’m not doing. Notice that I’m not saying Oracle stock can reach $148 because it did so recently. Rather, I’m specifically focused on the 135/140 bull spread because historically, that is where ORCL has ended up under similar conditions.

