ajax loader

Loading...


Ride-the-Wave Strategy – Best for Stock Traders

Ride-the-Wave targets multi-day price momentum following a company’s earnings announcement (EA). With this strategy:

  1. Buy a stock one day post-EA if a stock reacts positively post-earnings:
    1. Near the close of trading the EA-day for a pre-market-EA
    2. Near the close of the following day for a post-market-EA
  2. Sell-to-close after 7-10 days, or possibly earlier if a desired price target is reached

Similarly,

  1. short a stock one day post-EA if a stock reacts negatively post-earnings:
    1. near the close of trading the EA-day for a premarket-EA
    2. near the close of the following day for a post-market-EA
  2. then buy-to-close after 7-10 days, or possibly earlier if a desired price target is reached

Important: Ride-the-Wave is predicated on significant price momentum triggered by an EA. The 7-10 day scenario is the maximum trade hold-time. If you see post EA-momentum is halted or reversed by a significant opposite move, re-evaluate your presence in the trade.

This popular StockEarnings screen below will give you a list of stocks that historically exhibit significant price momentum following an EA for the next seven days:

  1. Stocks exhibiting positive post-EA price moves are buy-candidates
  2. Stocks exhibiting negative post-EA price moves are sell/short-candidates

The screen includes those stocks whose Earnings just came out in last two days.

Screen criteria:

  1. Earnings Date Start Date : Current Date + -1 Day
  2. Earnings Date End Date : Current Date + -2 Days
  3. Predicted Move (Next Day) Max : 7%
  4. Predicted Move (On 7th Day) Min : 7%

Strategy Guideline:

  1. Buy the stock if stock has reacted positively. Short the stock if stock has reacted negatively (see above).
  2. Close the position in 7-10 days, or possibly earlier based on price move.

Volatility Crush Strategy - Best for Options Traders

The Volatility Crush strategy is used with stocks that typically experience relatively low-to-moderate price moves (≤4%) following their Earnings Announcements (EA). The basic trade idea is to sell put or call options right before the EA, collecting a credit when options premium is very high due to elevated implied volatility (IV). You then close the position right after the EA by buying the option back much cheaper due to the significant drop in IV that occurs after the mystery of the EA disappears. In assessing this trade, you need to do your homework to ensure you collect sufficient premium to make the trade worthwhile.

This trade is practical due to the low-to-moderate price-move after the EA, which generally won’t significantly affect the options price, unlike an “action” stock, which experience great price moves post-EA. With these symbols, if you’re on the right side of the price move, that’s a great thing. But if you’re on the wrong side of the move, not so great. Consequently, by minimizing the effect of the post-EA price move, you have a much better chance to profit from the reduction in IV without it being ruined by a violent price move.

For this trade, open the position either (1) the night before the EA when the company announces earnings or (2) during the EA day when it announces post-market, generally capturing IV at or close to its peak.

For this trade, open the position either (1) the night before the EA when the company announces earnings or (2) during the EA day when it announces post-market, generally capturing IV at or close to its peak.

This popular stockearnings screen will give you a list of stocks which do not react more than 4% fpost-EA. It includes only those stocks whose earnings are releasing next day.

Screen criteria:

  1. Earnings Date Start Date : Current Date + 1
  2. Earnings Date End Date : Current Date + 1
  3. Predicted Move (Next Day) Max : 4%
  4. Options Type: Weekly

Strategy Guideline:

  1. Options Strategy: Sell Call and Put
  2. Options Strike Price: Current Stock Price – (% Predicated Move x 2)
  3. Expiration Date: It should generally be the closest expiry immediately after the EA.
  4. Buy Insurance: Buying back Call and Put at Strike price which 10% lower than Sell Strike Price is optional but recommended.

Watch Video for More Detail

Volatility Rush Strategy - Best for Options Traders

The Volatility Rush takes advantage of increasing options premiums into earnings announcements (EA) caused by an anticipated rise in Implied Volatility (IV). With this strategy, Buy a Call and Put at-the-money (a long straddle) 2-3 weeks before the EA when IV is lower. Sell the position either (1) the night before the EA when the company announces earnings pre-market, or (2) during the EA day when it announces post-market, generally capturing IV at or close to its peak.

This popular screen will give you a list of stocks whose Options premiums tend to rise into Earnings. It includes only those stocks whose Earnings are at least two weeks away from today.

Screen criteria:

  1. Earnings Date Start Date : Current Date + 15 Days
  2. Earnings Date End Date : Current Date + 30 Days
  3. Predicted Move (Next Day) Min : 5%
  4. Options Type: Weekly or Monthly if that lines up with the two to three-week lead-time for entering the trade

Strategy Guideline:

  1. Buy a Straddle at or close to the money two to three weeks pre-EA.
  2. Sell the position either the night before the EA when the company announces earnings pre-market, or during the EA day when it announces post-market.
  3. Expiration date should generally be the closest expiry immediately after the EA.
  4. Straddle price should not be more 60% of predicted move.

Predicted Move (Volatility)

Similar to Implied Volatility in Options. Expected volatility % based on our Proprietary Volatility Predication Model. We are expecting that stock price will likely to reach % in either direction by the end of next trading session after Earnings are released and not necessarily the closing volatility %.

Why is it important?

    This indicator helps

  1. Knowing expected volatility in stocks after Earnings helps to decide trading stocks before Earnings Announcement.
  2. Taking Advantage of volatility collapse following Earnings Results by using Advance Options strategies such as Spread and Straddles.

Since Last Earnings

Change in share price since last Earnings release.

Why is it Important?

When share has gained more than 10% since it's last Earning release, it tends to over react to minor bad news and give up some gains if not all. So, it contains more downside volatility than upside When share has dropped more than 10% since it's last Earning release, it tends to over react to minor good news and recover some drops if not all. So, it contains more upside volatility than downside.

EPS Surprise (%)

Occurs when a company's reported quarterly or annual profits are above or below analysts' expectations. Here is the formula to derive % EPS Surprice:

Actual EPS - Estimated EPS
------------------------------------- x 100
Estimated EPS

Why is it Important?

Earnings surprises can have a huge impact on a company's stock price. Several studies suggest that positive earnings surprises not only lead to an immediate hike in a stock's price, but also to a gradual increase over time. Hence, it's not surprising that some companies are known for routinely beating earning projections. A negative earnings surprise will usually result in a decline in share price.

Next Day Price Change (%)

Next Regular trading session Closing price following Earnings result.

For After Market Close Earnings, It is a next trading day closing price. For Before Market Open Earnings, It is the same trading day closing price.

Why is it Important?

Next Day price change is a reaction of Earnings result.

Spotify’s Miss Buried Its Most Important Number In It’s Q2 Earnings Report

Posted on Aug 04, 2026 by Grayson Cavern

Spotify’s Miss Buried Its Most Important Number In It’s Q2 Earnings Report

Spotify Technology (NYSE: SPOT) walked into its second-quarter report with investors braced for another clean beat, and instead got a revenue print of €4.78 billion and diluted EPS of €2.61 –  both short of consensus – paired with third-quarter guidance for operating income and user growth that landed below what the market wanted.

Shares opened down 3.98% to $466.97. The reaction fits the pattern, because a stock that rallied this hard rarely gets forgiven for a stumble. And yet the figures that missed tell you almost nothing about the quarter that actually happened.

€4.89 Is Doing The Work Users Can’t


Total monthly active users hit 777 million and Premium subscribers crossed 300 million, but the line that matters sits one level down. Premium revenue grew 15% to €4.33 billion, outpacing subscriber growth itself, because pricing carried part of the load, ARPU climbed 7% to €4.89 even after foreign-exchange drag. 

Spotify did not merely add customers this quarter; it made the ones it already had worth more, and that changes how the whole business compounds. Adding ten million free listeners helps the funnel, but converting existing listeners into higher-value relationships and lifting the revenue pulled from each account produces a far stronger result with much less dependence on explosive audience growth.

A single euro of added ARPU across 300 million paying accounts falls almost straight to operating income at nearly no incremental cost – something free listeners who never convert can never match. The company added 7 million Premium subscribers, beating its own guidance even as total MAU additions came in light. Its roadmap tells the same story, expanded Audiobooks+, AI-powered Personal Podcasts, DJ rolling into four more languages, features built to deepen engagement rather than inflate the top of the funnel.

How 1% Ad Growth Stopped Steering The Ship

Advertising remains the softest part of the story, though not for the reason most assume. Ad-supported revenue rose just 1% year over year, with management pointing to healthy impressions sold against genuine softness in pricing, music advertising most of all.

Read that carefully, because it describes a rate problem, not a demand problem – advertisers are still buying, listeners are still spending time, and the only pressure is what each impression fetches. While advertising drifted sideways, the rest of the income statement kept building: gross margin expanded again to 33.4%, operating cash flow reached €816 million, and free cash flow approached €800 million even with operating income easing off an unusually strong first quarter. Advertising simply no longer sets this company’s financial direction. Premium economics has now taken that job.

Sellers Stopped At $460, Not Below It

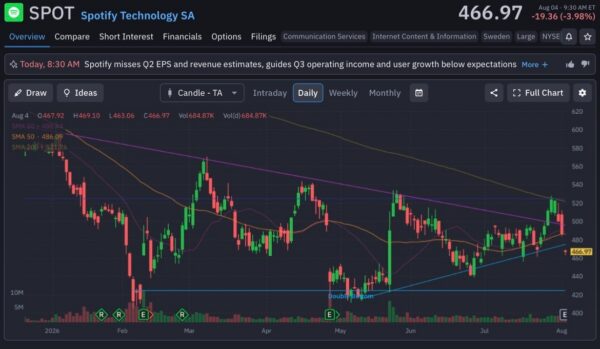
The technical picture explains why one miss produced a 4% gap. Coming off the May double bottom near $420, Spotify spent months carving higher lows along a rising trendline, reclaimed its 20-day and 50-day moving averages, and by late July had climbed to challenge its declining 200-day at $521.76 – the level that has capped every rally this year. It failed there, and the earnings miss finished the job, dropping the stock 3.98% to $466.97 on volume near 685,000 shares.

That turnover ran hotter than the quiet sessions that built this base, yet fell well short of the panic washouts that mark a broken uptrend. That slide cut back beneath the 20-day at $488.44 and the 50-day at $486.09 in a single session, which looks ugly until you see where the selling stopped. Price fell to the ascending trendline that has defined the entire recovery since May, around $460, and held. Institutions trimmed into the gap, yet never distributed through the base; the double-bottom floor at $420 was never threatened, which tells you the sellers were repricing their expectations rather than fleeing the story.
spotify-StockEarnings

$460 Is The Entry This Miss Created

For the everyday investor, the takeaway is simpler than the tape suggests. You are looking at a company that grew its most profitable revenue line 15%, expanded margins, generated nearly €800 million in free cash flow, and beat its own subscriber target – and its stock is cheaper today because a reported revenue miss disappointed a crowd that had priced in perfection. 

Management’s Q3 guide – 305 million Premium subscribers, 788 million MAUs, €5.0 billion in revenue, €670 million in operating income – points to continued momentum in the areas now driving the business.

If you already own it, nothing here breaks the thesis; the engine that matters is still accelerating. If you have wanted in, this gap to trendline support near $460 offers a cleaner entry than the $520s did three weeks ago, with a floor at $420 the market has already defended twice. I would treat a hold above $460 as confirmation the recovery is intact and a break of $420 as the only real reason to walk away. The math tilts toward the buyer here: risking a slide to $420 against a rebound toward the $520s is close to a three-to-one payoff if the Premium engine keeps compounding. 

A few months ago, I said Spotify had stopped chasing the biggest audience in streaming, and it was building the most valuable one, the thesis holds today, and down days like this are the price of owning that shift before the market re-rates it.


Join over 1.2M+ investors/traders who receive daily and weekly notable earnings alerts with predicted move