Most financial articles provide a long-term investment proposition. Just to be straight up, that’s not going to be the case with this story regarding cruise ship operator Carnival (NYSE: CCL). I have zero idea where CCL stock may end up in a year from now, particularly because of the uncertainties associated with the devolving Iran crisis. However, in the short term, Carnival could intrigue bullish speculators.
It comes down to a simple proposition: stock market returns are path-dependent. In layman’s terms, this concept simply means that a popular ticker like CCL stock is heavily influenced regarding its future direction by immediate factors that impact momentum and market psychology. Basically, the future state of CCL is heavily dependent on the current state.
That might sound like a no-brainer and I would argue that this is the primary presupposition that drives the financial publication ecosystem. No one is really interested in how CCL stock might take a random walk over the next several years. No, when people read stories about Carnival, they’re looking for some idea of whether or not it’s a buying opportunity.
However, to assert that an equity is worth buying implies that the future market returns are dependent variables. In other words, because something is about to happen — whether that be margin expansion or robust revenue growth — the market may be underestimating the true value of the security at hand. So, the author’s hidden presupposition is that they have some idea of a favorable mispricing.
My argument for CCL stock doesn’t relate to its core fundamentals. Instead, I believe that structural dynamics in how Carnival is being priced present clues as to where it may head next over a defined time period.
It’s not a hard science but a probabilistic one. Still, an inductive model allows options traders to make reasonable assumptions about Carnival stock.
Understanding Path Dependency for CCL Stock
Before I identify what specific options trade I’m looking at, it’s helpful to understand why I believe what I believe. As mentioned above, I utilize an inductive model that presupposes that the price discovery process is path dependent.
Suppose you have a football game between two evenly matched teams, such that it’s extraordinarily difficult to predict who will come out on top. But typically, a football team is only as good as their quarterback allows them to be. If one of the two must sit out their QB due to injury, that would almost certainly change how the game is handicapped.
Well, naturally, you would expect the same for the equities market. If CCL stock finds itself in a distinctly bullish or bearish cycle, that state of affairs will likely influence how major market participants will approach the ticker.
For example, if Carnival stock has been on a hot streak for the last several months, the odds are that options traders will hedge against the perceived heightened risk of a corrective response. We know through experience that — even for hot entities like meme stocks or cryptocurrencies — what goes up must eventually come down.
Conversely, if Carnival stock were on an extended down streak, there’d be a decent chance that hedge funds and other institutional players may bid up call options. While economic circumstances impose hardships on travel-related enterprises, Carnival is still a solid business — and nothing short of a nuclear apocalypse will prevent people from going on cruises.
Therefore, we have good reason to believe that the equities market is reflexive. Nothing occurs in a vacuum. However, when it comes to options pricing, Wall Street doesn’t rely on path-dependent models.
Instead, the market utilizes some derivation of the Black-Scholes model, which is a path-independent framework. Yes, a security’s implied volatility (IV) is integrated into the underlying formula. However, IV acts as an “accelerant” within a predefined framework. For example, the longest touchdown pass possible is 99 yards. You can’t throw a touchdown longer than the actual in-play length of the field.
As such, Black-Scholes can only provide an output that is within the constraints of the formula itself, making it independent to key external influencers. Because this constraint may not be the best representation of market reality at one time, there is theoretically an opportunity for exploiting mispriced options.
A Peculiar Quant Signal Draws Intrigue for Carnival Stock
Getting back to CCL stock, while we may not know precisely where it may head next, we have an idea — based on path dependency — of where it has typically landed based on specific market conditions. In this case, Carnival flashed an unusual quantitative setup that may lead to an exploitable opportunity.
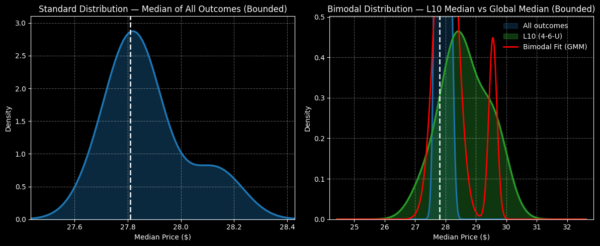
In the last 10 weeks, CCL stock printed only four up weeks, but with a strange twist. Although the number of negative sessions outweighed positive, Carnival has enjoyed an upward slope across the period. This 4-6-U sequence is rare, which has only materialized seven times since January 2019. However, when it flashes, the next 10 weeks tend to yield a choppy but generally positive performance.
Under a random 10-week hold of Carnival stock, the ticker would be expected to deliver a distribution of outcomes between $27.40 and $28.40 (assuming a starting price of $27.81). Given that peak probability density also occurs around the starting price, you would generally expect a neutral to slightly bearish bias. For a debit-side options trader, that’s not a great proposition.
In contrast, under 4-6-U conditions, the forward 10-week distribution would be forecasted to range between $26 and $31, with probability density peaking at around $28.40. While this forecast only provides a modest positive differential when comparing peak to peak, it’s the first two weeks following the flashing of the signal that are of the most interest to options traders.
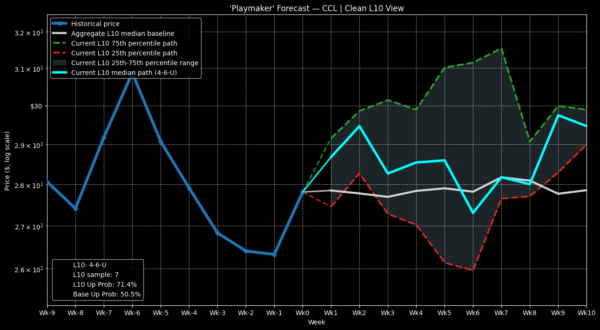
Running a Markov simulator to determine the historical median response following the 4-6-U signal, we may expect an endpoint price at the end of week 2 of roughly $29.40. Further, the 25th percentile median price stands at around $28.15, implying that even on below-average days, the signal still provides a bullish bias relative to the starting price of $27.81. Thus, even though we’re talking about extremely small sample sizes, I’m tempted to roll the dice.
Justifying the Temptation
If you’re in the gambling mood, I would consider the 28/29 bull call spread expiring Aug. 14. Should CCL stock rise through the $29 strike at expiration, the maximum payout clocks in at over 117%. Just as well, the net debit per spread is $46, meaning that you don’t have to risk much on this admittedly speculative idea.
From a mathematical perspective, the highlight of the above debit call spread is the breakeven price of $28.46. Wall Street assigns a probability of profit of only 39.5% that Carnival stock can hit this threshold at expiration. But you have to realize that this probability is a theoretical or academic one.
Essentially, the odds come from the Black-Scholes model, which may be problematic as it assumes that public securities are path-independent. The 39.5% figure is an assumed probability based on how likely it is for CCL stock to hit the $28.46 breakeven price assuming that the ticker moves within a risk-neutral, lognormal environment.
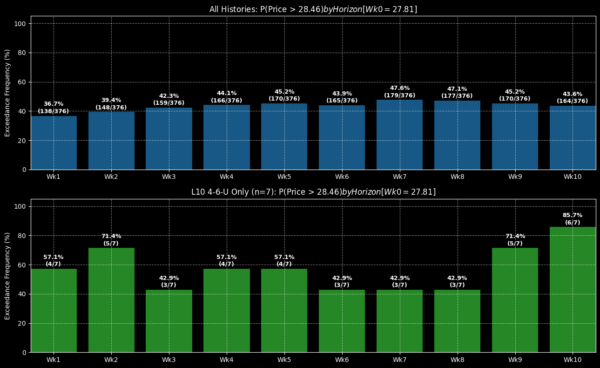
In contrast, I anticipate a volatility cluster in the first two weeks, which makes hitting the breakeven price far more likely (under my model). Specifically, of the nine times that the 4-6-U signal has flashed, Carnival stock has exceeded the $28.46 breakeven price a total of seven times at the end of week 2 (Aug. 14). Again, it’s an extremely small sample size but the arithmetic suggests that the observed probability of profit is 71.4%.
Granted, my model from a probabilistic viewpoint pits itself against Black-Scholes — and no one knows who will be right until the event actually happens. But if you find the path-dependent framework convincing, CCL stock is giving you a mathematical incentive to consider a short-term scalp.

