ajax loader

Loading...


Ride-the-Wave Strategy – Best for Stock Traders

Ride-the-Wave targets multi-day price momentum following a company’s earnings announcement (EA). With this strategy:

  1. Buy a stock one day post-EA if a stock reacts positively post-earnings:
    1. Near the close of trading the EA-day for a pre-market-EA
    2. Near the close of the following day for a post-market-EA
  2. Sell-to-close after 7-10 days, or possibly earlier if a desired price target is reached

Similarly,

  1. short a stock one day post-EA if a stock reacts negatively post-earnings:
    1. near the close of trading the EA-day for a premarket-EA
    2. near the close of the following day for a post-market-EA
  2. then buy-to-close after 7-10 days, or possibly earlier if a desired price target is reached

Important: Ride-the-Wave is predicated on significant price momentum triggered by an EA. The 7-10 day scenario is the maximum trade hold-time. If you see post EA-momentum is halted or reversed by a significant opposite move, re-evaluate your presence in the trade.

This popular StockEarnings screen below will give you a list of stocks that historically exhibit significant price momentum following an EA for the next seven days:

  1. Stocks exhibiting positive post-EA price moves are buy-candidates
  2. Stocks exhibiting negative post-EA price moves are sell/short-candidates

The screen includes those stocks whose Earnings just came out in last two days.

Screen criteria:

  1. Earnings Date Start Date : Current Date + -1 Day
  2. Earnings Date End Date : Current Date + -2 Days
  3. Predicted Move (Next Day) Max : 7%
  4. Predicted Move (On 7th Day) Min : 7%

Strategy Guideline:

  1. Buy the stock if stock has reacted positively. Short the stock if stock has reacted negatively (see above).
  2. Close the position in 7-10 days, or possibly earlier based on price move.

Volatility Crush Strategy - Best for Options Traders

The Volatility Crush strategy is used with stocks that typically experience relatively low-to-moderate price moves (≤4%) following their Earnings Announcements (EA). The basic trade idea is to sell put or call options right before the EA, collecting a credit when options premium is very high due to elevated implied volatility (IV). You then close the position right after the EA by buying the option back much cheaper due to the significant drop in IV that occurs after the mystery of the EA disappears. In assessing this trade, you need to do your homework to ensure you collect sufficient premium to make the trade worthwhile.

This trade is practical due to the low-to-moderate price-move after the EA, which generally won’t significantly affect the options price, unlike an “action” stock, which experience great price moves post-EA. With these symbols, if you’re on the right side of the price move, that’s a great thing. But if you’re on the wrong side of the move, not so great. Consequently, by minimizing the effect of the post-EA price move, you have a much better chance to profit from the reduction in IV without it being ruined by a violent price move.

For this trade, open the position either (1) the night before the EA when the company announces earnings or (2) during the EA day when it announces post-market, generally capturing IV at or close to its peak.

For this trade, open the position either (1) the night before the EA when the company announces earnings or (2) during the EA day when it announces post-market, generally capturing IV at or close to its peak.

This popular stockearnings screen will give you a list of stocks which do not react more than 4% fpost-EA. It includes only those stocks whose earnings are releasing next day.

Screen criteria:

  1. Earnings Date Start Date : Current Date + 1
  2. Earnings Date End Date : Current Date + 1
  3. Predicted Move (Next Day) Max : 4%
  4. Options Type: Weekly

Strategy Guideline:

  1. Options Strategy: Sell Call and Put
  2. Options Strike Price: Current Stock Price – (% Predicated Move x 2)
  3. Expiration Date: It should generally be the closest expiry immediately after the EA.
  4. Buy Insurance: Buying back Call and Put at Strike price which 10% lower than Sell Strike Price is optional but recommended.

Watch Video for More Detail

Volatility Rush Strategy - Best for Options Traders

The Volatility Rush takes advantage of increasing options premiums into earnings announcements (EA) caused by an anticipated rise in Implied Volatility (IV). With this strategy, Buy a Call and Put at-the-money (a long straddle) 2-3 weeks before the EA when IV is lower. Sell the position either (1) the night before the EA when the company announces earnings pre-market, or (2) during the EA day when it announces post-market, generally capturing IV at or close to its peak.

This popular screen will give you a list of stocks whose Options premiums tend to rise into Earnings. It includes only those stocks whose Earnings are at least two weeks away from today.

Screen criteria:

  1. Earnings Date Start Date : Current Date + 15 Days
  2. Earnings Date End Date : Current Date + 30 Days
  3. Predicted Move (Next Day) Min : 5%
  4. Options Type: Weekly or Monthly if that lines up with the two to three-week lead-time for entering the trade

Strategy Guideline:

  1. Buy a Straddle at or close to the money two to three weeks pre-EA.
  2. Sell the position either the night before the EA when the company announces earnings pre-market, or during the EA day when it announces post-market.
  3. Expiration date should generally be the closest expiry immediately after the EA.
  4. Straddle price should not be more 60% of predicted move.

Predicted Move (Volatility)

Similar to Implied Volatility in Options. Expected volatility % based on our Proprietary Volatility Predication Model. We are expecting that stock price will likely to reach % in either direction by the end of next trading session after Earnings are released and not necessarily the closing volatility %.

Why is it important?

    This indicator helps

  1. Knowing expected volatility in stocks after Earnings helps to decide trading stocks before Earnings Announcement.
  2. Taking Advantage of volatility collapse following Earnings Results by using Advance Options strategies such as Spread and Straddles.

Since Last Earnings

Change in share price since last Earnings release.

Why is it Important?

When share has gained more than 10% since it's last Earning release, it tends to over react to minor bad news and give up some gains if not all. So, it contains more downside volatility than upside When share has dropped more than 10% since it's last Earning release, it tends to over react to minor good news and recover some drops if not all. So, it contains more upside volatility than downside.

EPS Surprise (%)

Occurs when a company's reported quarterly or annual profits are above or below analysts' expectations. Here is the formula to derive % EPS Surprice:

Actual EPS - Estimated EPS
------------------------------------- x 100
Estimated EPS

Why is it Important?

Earnings surprises can have a huge impact on a company's stock price. Several studies suggest that positive earnings surprises not only lead to an immediate hike in a stock's price, but also to a gradual increase over time. Hence, it's not surprising that some companies are known for routinely beating earning projections. A negative earnings surprise will usually result in a decline in share price.

Next Day Price Change (%)

Next Regular trading session Closing price following Earnings result.

For After Market Close Earnings, It is a next trading day closing price. For Before Market Open Earnings, It is the same trading day closing price.

Why is it Important?

Next Day price change is a reaction of Earnings result.

Johnson & Johnson Is Proving To Be Less Dependent On Patent Cliffs

Posted on Jul 15, 2026 by Grayson Cavern

Johnson & Johnson Is Proving To Be Less Dependent On Patent Cliffs

When I broke down Johnson & Johnson’s (NYSE: JNJ) first-quarter earnings on April 15, my central argument wasn’t really about Stelara. It was about what Stelara represented –  a company approaching one of the largest patent cliffs in its history with a margin for error that was beginning to visibly narrow, and a growth story increasingly dependent on whether a handful of successor products could absorb the erosion fast enough to keep the headline numbers intact.

Three months later, the conversation has changed. Not because the patent cliff disappeared, but because this 2nd quarter provided genuine evidence that Johnson & Johnson may be building a business where no single expiry can dictate the entire investment thesis anymore.

Let’s Talk About The Mechanism Behind The Headline Numbers 


Johnson & Johnson reported adjusted EPS of $2.90 on $25.3 billion in revenue, beating Wall Street’s expectations comfortably and raising full-year guidance to $100.8–$101.4 billion in revenue alongside adjusted EPS guidance of $11.50–$11.65. Adjusted operational sales grew 5.8%, and this marks the second consecutive quarter where management had enough confidence in the forward trajectory to lift the outlook rather than simply defend it. 

What’s even more impressive is the context they were produced inside. Stelara is still creating roughly a 460-basis-point drag on company-wide sales, a headwind large enough to derail most pharmaceutical earnings stories, and Johnson & Johnson (NYSE: JNJ) still delivered 6.6% revenue growth and raised guidance anyway. That combination is not something most drug companies achieve while absorbing a biosimilar erosion of this magnitude, and the fact that it happened doesn’t mean the patent cliff problem has been solved. It means the rest of the business has grown large and diversified enough to absorb a hit that would have been far more damaging even two years ago.

How The Company Reduced Its Dependence On Stelara

The traditional pharmaceutical model has always rested on a version of the same cycle: one breakthrough drug drives years of growth, one patent expiry threatens years of growth, and the entire investment case pivots around whether the pipeline can produce a successor in time. That cycle hasn’t disappeared from Johnson & Johnson’s story, but this 2nd quarter earnings suggest the company is systematically reducing its influence over the outcome, and the distinction between replacing a blockbuster and reducing dependence on one is more important than it might appear.

Inside Innovative Medicine, Stelara created roughly a 760-basis-point drag on segment sales, yet the division still generated $16.4 billion in revenue and grew 7.8% on a reported basis. Darzalex continued expanding its leadership in multiple myeloma, Carvykti maintained its commercial rollout, Tremfya kept gaining share across immunology, and Rybrevant and Lazcluze continued building out the oncology franchise. MedTech added another $8.9 billion, growing 4.5%, with Shockwave, Electrophysiology, and Vision all contributing to a segment that operates largely independently of the pharmaceutical patent cycle entirely.

Unlike most pharmaceutical companies, the growth wasn’t concentrated in one product being positioned as the next Stelara. It was distributed across multiple businesses in multiple categories, each carrying a different expiry timeline and a different competitive dynamic. That distribution is precisely the shift worth tracking, because a company where ten products each contribute meaningfully is a structurally different risk profile from a company where two products carry the entire story, and Johnson & Johnson is gradually moving toward the former.

Institutional Conviction?

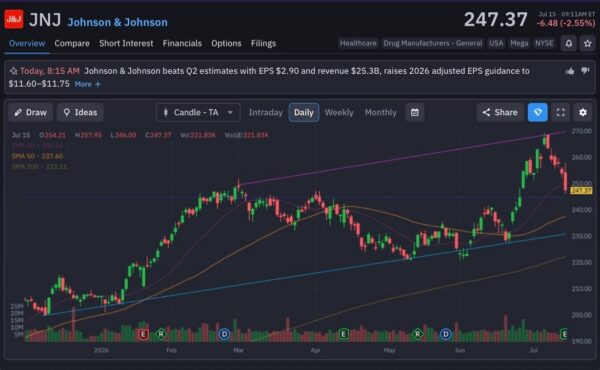
The immediate earnings reaction wasn’t particularly encouraging, with shares pulling back from briefly touching $258 to finish the session around $247.37. Taken in isolation, that’s easy to read as disappointment. Placed in the context of the broader chart, it looks considerably more like a post-earnings reset inside an intact uptrend than the beginning of a more serious reassessment.

Shares continue trading comfortably above the 50-day moving average at $237.60 and the 200-day moving average at $222.21, preserving the structural uptrend that has been building since the spring, while the 20-day moving average at $250.16 now becomes the first level investors will watch as the stock attempts to reclaim momentum. Trading volume of roughly 221,800 shares during the session doesn’t suggest broad institutional liquidation. It suggests the kind of modest profit-taking that typically follows a beat-and-raise quarter that had already been partially anticipated by the move heading into it.

For a company navigating one of the most significant patent expirations in the pharmaceutical industry’s recent history, a chart that continues respecting every major moving average and holding a multi-month uptrend is telling you something about how the market is weighing the longer-term thesis against the near-term Stelara noise.
johnson & johnson-StockEarnings

Next Question

Every pharmaceutical company faces patent cliffs. That’s a structural feature of the industry that separates companies capable of compounding through disruption from those that require a single breakthrough to sustain the entire story. And the companies that keep creating shareholder value through those transitions aren’t necessarily the ones that avoid the cliffs. They’re the ones that make sure no single drug carries enough influence to derail the business once exclusivity expires.

That’s the framework I’ll carry into Johnson & Johnson’s next several quarters – whether revenue continues arriving from a broadening collection of products, therapies, and medical technologies that share the load rather than concentrate it. Because if that distribution keeps widening, future patent expirations become events to monitor rather than crises to manage, and that would represent a far more durable shift than any single strong quarter can capture on its own.


Join over 1.2M+ investors/traders who receive daily and weekly notable earnings alerts with predicted move