ajax loader

Loading...


Ride-the-Wave Strategy – Best for Stock Traders

Ride-the-Wave targets multi-day price momentum following a company’s earnings announcement (EA). With this strategy:

  1. Buy a stock one day post-EA if a stock reacts positively post-earnings:
    1. Near the close of trading the EA-day for a pre-market-EA
    2. Near the close of the following day for a post-market-EA
  2. Sell-to-close after 7-10 days, or possibly earlier if a desired price target is reached

Similarly,

  1. short a stock one day post-EA if a stock reacts negatively post-earnings:
    1. near the close of trading the EA-day for a premarket-EA
    2. near the close of the following day for a post-market-EA
  2. then buy-to-close after 7-10 days, or possibly earlier if a desired price target is reached

Important: Ride-the-Wave is predicated on significant price momentum triggered by an EA. The 7-10 day scenario is the maximum trade hold-time. If you see post EA-momentum is halted or reversed by a significant opposite move, re-evaluate your presence in the trade.

This popular StockEarnings screen below will give you a list of stocks that historically exhibit significant price momentum following an EA for the next seven days:

  1. Stocks exhibiting positive post-EA price moves are buy-candidates
  2. Stocks exhibiting negative post-EA price moves are sell/short-candidates

The screen includes those stocks whose Earnings just came out in last two days.

Screen criteria:

  1. Earnings Date Start Date : Current Date + -1 Day
  2. Earnings Date End Date : Current Date + -2 Days
  3. Predicted Move (Next Day) Max : 7%
  4. Predicted Move (On 7th Day) Min : 7%

Strategy Guideline:

  1. Buy the stock if stock has reacted positively. Short the stock if stock has reacted negatively (see above).
  2. Close the position in 7-10 days, or possibly earlier based on price move.

Volatility Crush Strategy - Best for Options Traders

The Volatility Crush strategy is used with stocks that typically experience relatively low-to-moderate price moves (≤4%) following their Earnings Announcements (EA). The basic trade idea is to sell put or call options right before the EA, collecting a credit when options premium is very high due to elevated implied volatility (IV). You then close the position right after the EA by buying the option back much cheaper due to the significant drop in IV that occurs after the mystery of the EA disappears. In assessing this trade, you need to do your homework to ensure you collect sufficient premium to make the trade worthwhile.

This trade is practical due to the low-to-moderate price-move after the EA, which generally won’t significantly affect the options price, unlike an “action” stock, which experience great price moves post-EA. With these symbols, if you’re on the right side of the price move, that’s a great thing. But if you’re on the wrong side of the move, not so great. Consequently, by minimizing the effect of the post-EA price move, you have a much better chance to profit from the reduction in IV without it being ruined by a violent price move.

For this trade, open the position either (1) the night before the EA when the company announces earnings or (2) during the EA day when it announces post-market, generally capturing IV at or close to its peak.

For this trade, open the position either (1) the night before the EA when the company announces earnings or (2) during the EA day when it announces post-market, generally capturing IV at or close to its peak.

This popular stockearnings screen will give you a list of stocks which do not react more than 4% fpost-EA. It includes only those stocks whose earnings are releasing next day.

Screen criteria:

  1. Earnings Date Start Date : Current Date + 1
  2. Earnings Date End Date : Current Date + 1
  3. Predicted Move (Next Day) Max : 4%
  4. Options Type: Weekly

Strategy Guideline:

  1. Options Strategy: Sell Call and Put
  2. Options Strike Price: Current Stock Price – (% Predicated Move x 2)
  3. Expiration Date: It should generally be the closest expiry immediately after the EA.
  4. Buy Insurance: Buying back Call and Put at Strike price which 10% lower than Sell Strike Price is optional but recommended.

Watch Video for More Detail

Volatility Rush Strategy - Best for Options Traders

The Volatility Rush takes advantage of increasing options premiums into earnings announcements (EA) caused by an anticipated rise in Implied Volatility (IV). With this strategy, Buy a Call and Put at-the-money (a long straddle) 2-3 weeks before the EA when IV is lower. Sell the position either (1) the night before the EA when the company announces earnings pre-market, or (2) during the EA day when it announces post-market, generally capturing IV at or close to its peak.

This popular screen will give you a list of stocks whose Options premiums tend to rise into Earnings. It includes only those stocks whose Earnings are at least two weeks away from today.

Screen criteria:

  1. Earnings Date Start Date : Current Date + 15 Days
  2. Earnings Date End Date : Current Date + 30 Days
  3. Predicted Move (Next Day) Min : 5%
  4. Options Type: Weekly or Monthly if that lines up with the two to three-week lead-time for entering the trade

Strategy Guideline:

  1. Buy a Straddle at or close to the money two to three weeks pre-EA.
  2. Sell the position either the night before the EA when the company announces earnings pre-market, or during the EA day when it announces post-market.
  3. Expiration date should generally be the closest expiry immediately after the EA.
  4. Straddle price should not be more 60% of predicted move.

Predicted Move (Volatility)

Similar to Implied Volatility in Options. Expected volatility % based on our Proprietary Volatility Predication Model. We are expecting that stock price will likely to reach % in either direction by the end of next trading session after Earnings are released and not necessarily the closing volatility %.

Why is it important?

    This indicator helps

  1. Knowing expected volatility in stocks after Earnings helps to decide trading stocks before Earnings Announcement.
  2. Taking Advantage of volatility collapse following Earnings Results by using Advance Options strategies such as Spread and Straddles.

Since Last Earnings

Change in share price since last Earnings release.

Why is it Important?

When share has gained more than 10% since it's last Earning release, it tends to over react to minor bad news and give up some gains if not all. So, it contains more downside volatility than upside When share has dropped more than 10% since it's last Earning release, it tends to over react to minor good news and recover some drops if not all. So, it contains more upside volatility than downside.

EPS Surprise (%)

Occurs when a company's reported quarterly or annual profits are above or below analysts' expectations. Here is the formula to derive % EPS Surprice:

Actual EPS - Estimated EPS
------------------------------------- x 100
Estimated EPS

Why is it Important?

Earnings surprises can have a huge impact on a company's stock price. Several studies suggest that positive earnings surprises not only lead to an immediate hike in a stock's price, but also to a gradual increase over time. Hence, it's not surprising that some companies are known for routinely beating earning projections. A negative earnings surprise will usually result in a decline in share price.

Next Day Price Change (%)

Next Regular trading session Closing price following Earnings result.

For After Market Close Earnings, It is a next trading day closing price. For Before Market Open Earnings, It is the same trading day closing price.

Why is it Important?

Next Day price change is a reaction of Earnings result.

GameStop’s Revenue Fell 19%, Yet Operating Profit More Than Doubled

Posted on Sep 09, 2026 by Grayson Cavern

GameStop’s Revenue Fell 19%, Yet Operating Profit More Than Doubled

GameStop Corp. (NYSE: GME) reported second-quarter revenue of $790.2 million, down 18.7% from a year ago but comfortably above Wall Street’s $756.9 million estimate, while adjusted EPS came in at $0.27, matching consensus.

At first glance, this looks like a business losing ground, especially with the company selling nearly $200 million less than it did in the same quarter last year, but GameStop somehow turned that smaller sales base into $160.2 million of operating income, more than twice what it produced a year ago and its highest second-quarter operating profit in company history.

That is the unmissable part of this report. More so because GameStop may be discovering that the business it needs to become is considerably smaller than the one it spent decades building.

The Collectibles Shift Is Doing More Than Replacing Lost Game Sales


GameStop’s collectibles business grew 57% to $356.3 million in the quarter, taking its share of total sales to 45.1%, up from 23.4% a year earlier, while the company’s traditional video-game business contracted sharply. 

Quite remarkable change for a company that spent most of its history making money from people buying video games, consoles and used games, but I wouldn’t call the collectibles growth a success story just yet because trading cards, toys and other merchandise can be a very different business from the one GameStop is leaving behind.

The reason I’m paying attention is that this shift was already visible in Q1, when collectibles accounted for 41.8% of revenue, meaning Q2 didn’t create the trend; it accelerated it. 

If GameStop can keep moving sales toward collectibles while cutting the costs attached to its shrinking legacy business, the company could end up with a much different earnings profile from the one investors have historically associated with the name.

And that gives us something much more useful to watch than the revenue decline itself: whether GameStop can keep growing profit even as the old business gets smaller.

Make More Money From Less Revenue

There is a reason I don’t want to hang the entire argument on GameStop’s $298.7 million net income, because nearly $238 million of the quarter’s earnings came from the company’s investment in eBay while the retail business itself produced $160.2 million of operating income, and that gives us a cleaner way to see whether the turnaround is actually happening inside the stores rather than on the balance sheet. 

The improvement in the core business is hard to dismiss when gross margin rose to 42.2% from 31.4% a year earlier and SG&A fell by $31.7 million, even as revenue declined. GameStop also generated $174 million in adjusted EBITDA, compared with $75.7 million last year. 

That changes how I read the shrinking sales base. GameStop isn’t replacing every lost video-game dollar with a collectibles dollar. It is changing what kind of dollars make up the business, cutting expenses around the old model while putting more weight behind the category that is growing.

For the full year, management has now raised its adjusted EBITDA outlook to more than $650 million, up from the previous target of $600 million. 

If the company can keep producing that kind of operating leverage while collectibles take up an even larger share of the business, the old revenue comparisons will become less useful for judging what GameStop is worth.

The $238 Million Question Sitting Inside GameStop’s Profit

GameStop’s $298.7 million net profit looks impressive until you separate the retail business from the investment gains that helped produce it, because the company’s $4.9 billion eBay position generated a large mark-to-market benefit during the quarter while a $75 million loss on its digital assets moved in the opposite direction.

That makes the $160.2 million of operating income more useful for judging what actually happened to GameStop’s business, and the number becomes even more interesting when you remember that the company generated only $66.4 million in operating income in the same quarter last year.

I think investors need to keep those two stories separate as they look at what Ryan Cohen is building, because GameStop now has a retail operation whose economics are changing underneath it and an investment portfolio capable of moving the reported bottom line by hundreds of millions of dollars in a single quarter.

The eBay investment may eventually become an important part of the GameStop story, particularly after Cohen’s failed attempt to acquire the company, but the retail business has to prove that it can stand on its own first.

The Chart Still Has Work To Do

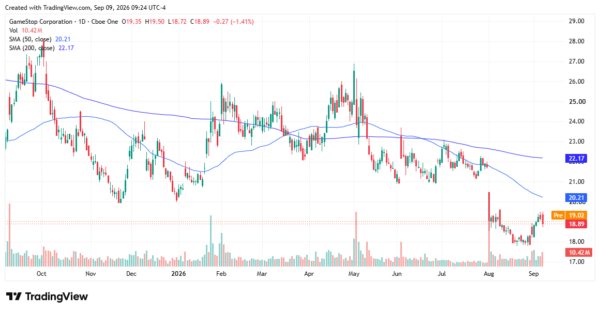
GME’s earnings may have given the business a reason to be taken more seriously, but the stock chart has not made the same argument yet, with shares closing at $18.89, below the 20-day moving average at roughly $19, the 50-day at $20.21 and the 200-day at $22.17.

The pattern is also difficult to call bullish after the sharp break from the $22–$23 range in August, which sent GME toward $18 before this week’s small recovery. The stock is trying to stabilize around those lows, but until it can reclaim the 20-day and then the 50-day averages, I would treat this as a bounce inside a damaged chart rather than the beginning of another sustained move higher.

There is a level I would watch closely: $22–$23, where the stock spent much of June and July consolidating before breaking lower. A move back through that zone would put GME above its 50-day average and within striking distance of the 200-day, giving the fundamental turnaround a much more convincing technical backdrop.

If GME can hold these lows and start reclaiming $20.20–$20.30, I’d be looking to get long, with $22–$23 as the next real test; for me, that’s the trade worth watching because the fundamentals are finally giving this beaten-down chart something to work with.
gamestop - StockEarnings

Join over 1.2M+ investors/traders who receive daily and weekly notable earnings alerts with predicted move
