ajax loader

Loading...


Ride-the-Wave Strategy – Best for Stock Traders

Ride-the-Wave targets multi-day price momentum following a company’s earnings announcement (EA). With this strategy:

  1. Buy a stock one day post-EA if a stock reacts positively post-earnings:
    1. Near the close of trading the EA-day for a pre-market-EA
    2. Near the close of the following day for a post-market-EA
  2. Sell-to-close after 7-10 days, or possibly earlier if a desired price target is reached

Similarly,

  1. short a stock one day post-EA if a stock reacts negatively post-earnings:
    1. near the close of trading the EA-day for a premarket-EA
    2. near the close of the following day for a post-market-EA
  2. then buy-to-close after 7-10 days, or possibly earlier if a desired price target is reached

Important: Ride-the-Wave is predicated on significant price momentum triggered by an EA. The 7-10 day scenario is the maximum trade hold-time. If you see post EA-momentum is halted or reversed by a significant opposite move, re-evaluate your presence in the trade.

This popular StockEarnings screen below will give you a list of stocks that historically exhibit significant price momentum following an EA for the next seven days:

  1. Stocks exhibiting positive post-EA price moves are buy-candidates
  2. Stocks exhibiting negative post-EA price moves are sell/short-candidates

The screen includes those stocks whose Earnings just came out in last two days.

Screen criteria:

  1. Earnings Date Start Date : Current Date + -1 Day
  2. Earnings Date End Date : Current Date + -2 Days
  3. Predicted Move (Next Day) Max : 7%
  4. Predicted Move (On 7th Day) Min : 7%

Strategy Guideline:

  1. Buy the stock if stock has reacted positively. Short the stock if stock has reacted negatively (see above).
  2. Close the position in 7-10 days, or possibly earlier based on price move.

Volatility Crush Strategy - Best for Options Traders

The Volatility Crush strategy is used with stocks that typically experience relatively low-to-moderate price moves (≤4%) following their Earnings Announcements (EA). The basic trade idea is to sell put or call options right before the EA, collecting a credit when options premium is very high due to elevated implied volatility (IV). You then close the position right after the EA by buying the option back much cheaper due to the significant drop in IV that occurs after the mystery of the EA disappears. In assessing this trade, you need to do your homework to ensure you collect sufficient premium to make the trade worthwhile.

This trade is practical due to the low-to-moderate price-move after the EA, which generally won’t significantly affect the options price, unlike an “action” stock, which experience great price moves post-EA. With these symbols, if you’re on the right side of the price move, that’s a great thing. But if you’re on the wrong side of the move, not so great. Consequently, by minimizing the effect of the post-EA price move, you have a much better chance to profit from the reduction in IV without it being ruined by a violent price move.

For this trade, open the position either (1) the night before the EA when the company announces earnings or (2) during the EA day when it announces post-market, generally capturing IV at or close to its peak.

For this trade, open the position either (1) the night before the EA when the company announces earnings or (2) during the EA day when it announces post-market, generally capturing IV at or close to its peak.

This popular stockearnings screen will give you a list of stocks which do not react more than 4% fpost-EA. It includes only those stocks whose earnings are releasing next day.

Screen criteria:

  1. Earnings Date Start Date : Current Date + 1
  2. Earnings Date End Date : Current Date + 1
  3. Predicted Move (Next Day) Max : 4%
  4. Options Type: Weekly

Strategy Guideline:

  1. Options Strategy: Sell Call and Put
  2. Options Strike Price: Current Stock Price – (% Predicated Move x 2)
  3. Expiration Date: It should generally be the closest expiry immediately after the EA.
  4. Buy Insurance: Buying back Call and Put at Strike price which 10% lower than Sell Strike Price is optional but recommended.

Watch Video for More Detail

Volatility Rush Strategy - Best for Options Traders

The Volatility Rush takes advantage of increasing options premiums into earnings announcements (EA) caused by an anticipated rise in Implied Volatility (IV). With this strategy, Buy a Call and Put at-the-money (a long straddle) 2-3 weeks before the EA when IV is lower. Sell the position either (1) the night before the EA when the company announces earnings pre-market, or (2) during the EA day when it announces post-market, generally capturing IV at or close to its peak.

This popular screen will give you a list of stocks whose Options premiums tend to rise into Earnings. It includes only those stocks whose Earnings are at least two weeks away from today.

Screen criteria:

  1. Earnings Date Start Date : Current Date + 15 Days
  2. Earnings Date End Date : Current Date + 30 Days
  3. Predicted Move (Next Day) Min : 5%
  4. Options Type: Weekly or Monthly if that lines up with the two to three-week lead-time for entering the trade

Strategy Guideline:

  1. Buy a Straddle at or close to the money two to three weeks pre-EA.
  2. Sell the position either the night before the EA when the company announces earnings pre-market, or during the EA day when it announces post-market.
  3. Expiration date should generally be the closest expiry immediately after the EA.
  4. Straddle price should not be more 60% of predicted move.

Predicted Move (Volatility)

Similar to Implied Volatility in Options. Expected volatility % based on our Proprietary Volatility Predication Model. We are expecting that stock price will likely to reach % in either direction by the end of next trading session after Earnings are released and not necessarily the closing volatility %.

Why is it important?

    This indicator helps

  1. Knowing expected volatility in stocks after Earnings helps to decide trading stocks before Earnings Announcement.
  2. Taking Advantage of volatility collapse following Earnings Results by using Advance Options strategies such as Spread and Straddles.

Since Last Earnings

Change in share price since last Earnings release.

Why is it Important?

When share has gained more than 10% since it's last Earning release, it tends to over react to minor bad news and give up some gains if not all. So, it contains more downside volatility than upside When share has dropped more than 10% since it's last Earning release, it tends to over react to minor good news and recover some drops if not all. So, it contains more upside volatility than downside.

EPS Surprise (%)

Occurs when a company's reported quarterly or annual profits are above or below analysts' expectations. Here is the formula to derive % EPS Surprice:

Actual EPS - Estimated EPS
------------------------------------- x 100
Estimated EPS

Why is it Important?

Earnings surprises can have a huge impact on a company's stock price. Several studies suggest that positive earnings surprises not only lead to an immediate hike in a stock's price, but also to a gradual increase over time. Hence, it's not surprising that some companies are known for routinely beating earning projections. A negative earnings surprise will usually result in a decline in share price.

Next Day Price Change (%)

Next Regular trading session Closing price following Earnings result.

For After Market Close Earnings, It is a next trading day closing price. For Before Market Open Earnings, It is the same trading day closing price.

Why is it Important?

Next Day price change is a reaction of Earnings result.

Healthcare’s Rally Hits a Crowding Problem

Posted on Sep 09, 2026 by Chris Markoch

Healthcare’s Rally Hits a Crowding Problem

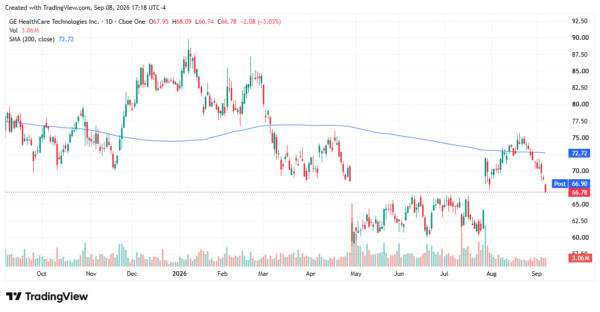
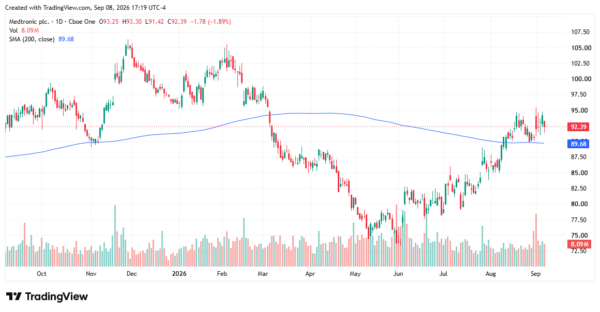
Healthcare stocks have had a strong run in 2026, but that strength is starting to invite its own risk. Heavy call buying has followed sharp rallies in GE HealthCare Technologies (NASDAQ: GEHC) and Medtronic (NYSE: MDT), pushing put-call ratios to levels that some options strategists now view as sell signals for both names.

GE HealthCare climbed more than 12% over a recent three-month stretch before crowded optimism showed up in the options data. Medtronic has soared roughly 26% since late May, triggering a similar contrarian warning. Both moves came alongside genuinely strong earnings reports, which is exactly what makes the setup tricky.

Strong fundamentals and crowded positioning can coexist. When too many investors chase the same trade at once, even good news struggles to push a stock higher. The next disappointment, however small, can trigger an outsized reaction. For investors watching the broader healthcare rally, GEHC and MDT are worth studying as a warning sign, not just two individual trade ideas.

What The Options Chains Are Signaling


Options positioning offers a read on sentiment that price alone doesn’t capture. When call buying dramatically outpaces put buying, it usually means traders are leaning heavily toward more upside. That’s bullish until it isn’t.

In GEHC’s options chain, near-term contracts show meaningful open interest building on the call side even as the stock has slid from its August highs near $77 down toward $67. That divergence, calls still active while price weakens, is a classic sign that positioning hasn’t caught up with reality yet.

Medtronic’s chain tells a related story. Volume and open interest cluster around strikes just above and below the current $92 level, with call-heavy activity following the stock’s climb off its May lows. Both patterns point to the same conclusion: traders have been betting on continuation, not correction.

That’s the setup options strategists watch for. Crowded call positioning after a big run doesn’t guarantee a pullback. But it does mean the risk-reward has shifted. New money coming into these names now is paying up for optimism that’s already been priced in once.

GEHC Earnings: Strong Quarter, Weaker Reaction

GE HealthCare’s second-quarter results, released in late July, were genuinely solid. Revenue reached $5.3 billion, up 5.7% year-over-year, with organic growth of 3.5%. Adjusted earnings per share came in at $1.13, up 6.6%.

The company’s growth engines performed well. Advanced Imaging Solutions grew 7.9%, and Pharmaceutical Diagnostics jumped 15.6%. Orders growth hit 11.1%, the strongest pace since the company’s 2023 spinoff from GE. Backlog climbed to a record $23.9 billion, with a book-to-bill ratio of 1.15 times.

Management reaffirmed full-year guidance: organic revenue growth of 3% to 4%, adjusted EBIT margin of 15.4% to 15.7%, and adjusted EPS between $4.80 and $5.00. Shares jumped 12% the morning when the results were released.

But that pop didn’t hold. Patient Care Solutions revenue fell 13.3%, and the stock has since drifted well below its 200-day moving average. The underlying business is executing. The stock, weighed down by crowded call positioning built during the rally, hasn’t been able to hold its gains. That combination, strong numbers and fading price action, is often where contrarian sell signals start to matter.
healthcare - StockEarnings

MDT Earnings: A Blowout Quarter, But Watch The Caveats

Medtronic’s first-quarter fiscal 2027 results, released September 1, were even stronger on the surface. Revenue hit $9.8 billion, up 13.7%; both figures were in line with analysts’ expectations and reflected organic growth. Non-GAAP EPS reached $1.45, up 15.1% year-over-year.

Cardiovascular led the way, growing 19.5% as reported. Cardiac Ablation Solutions surged 88% worldwide, gaining nine points of U.S. market share. Diabetes revenue grew 16.9%, and Medical Surgical and Neuroscience both posted double-digit or near double-digit gains.

Management raised full-year guidance twice over: organic revenue growth guidance was raised to 7.25%-7.75%, and non-GAAP EPS guidance rose to $5.94-$6.00. Shares jumped roughly 2.5% in premarket trading on the news.

Here’s the caveat worth flagging for readers. Medtronic’s quarter included an extra fiscal week, worth an estimated $570 million, or about 670 basis points, of that organic growth figure. Strip that out, and the underlying growth was closer to 7%, still the company’s best pace in nearly eight years, but not quite as dramatic as the headline number suggests.

That distinction matters for the crowding thesis. Options traders piling into calls after a 26% run may be reacting to the headline growth rate rather than the adjusted one. When the calendar boost rolls off next quarter, comparisons get tougher. That’s exactly the kind of gap between perception and fundamentals that can catch crowded positioning off guard.
healthcare - StockEarnings

The Takeaway For Investors

GEHC and MDT both delivered real, defensible earnings beats. Neither stock’s fundamental story is in question right now. What’s changed is the crowd around them.

When call buying accelerates faster than a stock can justify, the trade becomes as much about positioning as it is about performance. That’s the risk sitting underneath healthcare’s hot streak. A sector can be fundamentally sound and still leave short-term investors exposed if sentiment runs too far ahead of the numbers.

For investors holding GEHC or MDT, the message isn’t to panic. It’s to recognize that some of the recent upside may already be priced in through options markets. Watching how put-call ratios normalize after this stretch could offer an early read on whether the broader healthcare rally still has room to run or needs to cool off first.


A former marketing copywriter turned freelance financial writer and market analyst. I have a passion for delivering insights to investors. I write regularly about stocks for StockEarnings and MarketBeat. Posts are not advice.

Join over 1.2M+ investors/traders who receive daily and weekly notable earnings alerts with predicted move