ajax loader

Loading...


Ride-the-Wave Strategy – Best for Stock Traders

Ride-the-Wave targets multi-day price momentum following a company’s earnings announcement (EA). With this strategy:

  1. Buy a stock one day post-EA if a stock reacts positively post-earnings:
    1. Near the close of trading the EA-day for a pre-market-EA
    2. Near the close of the following day for a post-market-EA
  2. Sell-to-close after 7-10 days, or possibly earlier if a desired price target is reached

Similarly,

  1. short a stock one day post-EA if a stock reacts negatively post-earnings:
    1. near the close of trading the EA-day for a premarket-EA
    2. near the close of the following day for a post-market-EA
  2. then buy-to-close after 7-10 days, or possibly earlier if a desired price target is reached

Important: Ride-the-Wave is predicated on significant price momentum triggered by an EA. The 7-10 day scenario is the maximum trade hold-time. If you see post EA-momentum is halted or reversed by a significant opposite move, re-evaluate your presence in the trade.

This popular StockEarnings screen below will give you a list of stocks that historically exhibit significant price momentum following an EA for the next seven days:

  1. Stocks exhibiting positive post-EA price moves are buy-candidates
  2. Stocks exhibiting negative post-EA price moves are sell/short-candidates

The screen includes those stocks whose Earnings just came out in last two days.

Screen criteria:

  1. Earnings Date Start Date : Current Date + -1 Day
  2. Earnings Date End Date : Current Date + -2 Days
  3. Predicted Move (Next Day) Max : 7%
  4. Predicted Move (On 7th Day) Min : 7%

Strategy Guideline:

  1. Buy the stock if stock has reacted positively. Short the stock if stock has reacted negatively (see above).
  2. Close the position in 7-10 days, or possibly earlier based on price move.

Volatility Crush Strategy - Best for Options Traders

The Volatility Crush strategy is used with stocks that typically experience relatively low-to-moderate price moves (≤4%) following their Earnings Announcements (EA). The basic trade idea is to sell put or call options right before the EA, collecting a credit when options premium is very high due to elevated implied volatility (IV). You then close the position right after the EA by buying the option back much cheaper due to the significant drop in IV that occurs after the mystery of the EA disappears. In assessing this trade, you need to do your homework to ensure you collect sufficient premium to make the trade worthwhile.

This trade is practical due to the low-to-moderate price-move after the EA, which generally won’t significantly affect the options price, unlike an “action” stock, which experience great price moves post-EA. With these symbols, if you’re on the right side of the price move, that’s a great thing. But if you’re on the wrong side of the move, not so great. Consequently, by minimizing the effect of the post-EA price move, you have a much better chance to profit from the reduction in IV without it being ruined by a violent price move.

For this trade, open the position either (1) the night before the EA when the company announces earnings or (2) during the EA day when it announces post-market, generally capturing IV at or close to its peak.

For this trade, open the position either (1) the night before the EA when the company announces earnings or (2) during the EA day when it announces post-market, generally capturing IV at or close to its peak.

This popular stockearnings screen will give you a list of stocks which do not react more than 4% fpost-EA. It includes only those stocks whose earnings are releasing next day.

Screen criteria:

  1. Earnings Date Start Date : Current Date + 1
  2. Earnings Date End Date : Current Date + 1
  3. Predicted Move (Next Day) Max : 4%
  4. Options Type: Weekly

Strategy Guideline:

  1. Options Strategy: Sell Call and Put
  2. Options Strike Price: Current Stock Price – (% Predicated Move x 2)
  3. Expiration Date: It should generally be the closest expiry immediately after the EA.
  4. Buy Insurance: Buying back Call and Put at Strike price which 10% lower than Sell Strike Price is optional but recommended.

Watch Video for More Detail

Volatility Rush Strategy - Best for Options Traders

The Volatility Rush takes advantage of increasing options premiums into earnings announcements (EA) caused by an anticipated rise in Implied Volatility (IV). With this strategy, Buy a Call and Put at-the-money (a long straddle) 2-3 weeks before the EA when IV is lower. Sell the position either (1) the night before the EA when the company announces earnings pre-market, or (2) during the EA day when it announces post-market, generally capturing IV at or close to its peak.

This popular screen will give you a list of stocks whose Options premiums tend to rise into Earnings. It includes only those stocks whose Earnings are at least two weeks away from today.

Screen criteria:

  1. Earnings Date Start Date : Current Date + 15 Days
  2. Earnings Date End Date : Current Date + 30 Days
  3. Predicted Move (Next Day) Min : 5%
  4. Options Type: Weekly or Monthly if that lines up with the two to three-week lead-time for entering the trade

Strategy Guideline:

  1. Buy a Straddle at or close to the money two to three weeks pre-EA.
  2. Sell the position either the night before the EA when the company announces earnings pre-market, or during the EA day when it announces post-market.
  3. Expiration date should generally be the closest expiry immediately after the EA.
  4. Straddle price should not be more 60% of predicted move.

Predicted Move (Volatility)

Similar to Implied Volatility in Options. Expected volatility % based on our Proprietary Volatility Predication Model. We are expecting that stock price will likely to reach % in either direction by the end of next trading session after Earnings are released and not necessarily the closing volatility %.

Why is it important?

    This indicator helps

  1. Knowing expected volatility in stocks after Earnings helps to decide trading stocks before Earnings Announcement.
  2. Taking Advantage of volatility collapse following Earnings Results by using Advance Options strategies such as Spread and Straddles.

Since Last Earnings

Change in share price since last Earnings release.

Why is it Important?

When share has gained more than 10% since it's last Earning release, it tends to over react to minor bad news and give up some gains if not all. So, it contains more downside volatility than upside When share has dropped more than 10% since it's last Earning release, it tends to over react to minor good news and recover some drops if not all. So, it contains more upside volatility than downside.

EPS Surprise (%)

Occurs when a company's reported quarterly or annual profits are above or below analysts' expectations. Here is the formula to derive % EPS Surprice:

Actual EPS - Estimated EPS
------------------------------------- x 100
Estimated EPS

Why is it Important?

Earnings surprises can have a huge impact on a company's stock price. Several studies suggest that positive earnings surprises not only lead to an immediate hike in a stock's price, but also to a gradual increase over time. Hence, it's not surprising that some companies are known for routinely beating earning projections. A negative earnings surprise will usually result in a decline in share price.

Next Day Price Change (%)

Next Regular trading session Closing price following Earnings result.

For After Market Close Earnings, It is a next trading day closing price. For Before Market Open Earnings, It is the same trading day closing price.

Why is it Important?

Next Day price change is a reaction of Earnings result.

If You Want to Buy AMD Stock, You’ll Statistically Do Better by Waiting

Posted on Jul 31, 2026 by Joshua Enomoto

If You Want to Buy AMD Stock, You’ll Statistically Do Better by Waiting

Since this is the internet, I need to be explicit about this Advanced Micro Devices (NASDAQ: AMD) story: I am not making a permabear argument. With artificial intelligence rapidly becoming our flagship technology, AMD stock over the long run should be a strong investment. However, in the near term, especially for those trading AMD options, a cautionary approach is best.

Sure, I’m coming late to the game. On Wednesday, AMD stock dropped 5.51%. In the trailing five sessions, the ticker has sank more than 21%. If you look at the situation from the perspective of technical analysis, you can’t help but notice that the security has fallen off a sideways consolidation channel. With sellers apparently panicking, the fallout could get ugly.

I would also venture to say that the consensus among retail traders is to let the selloff fully die out before engaging. I’m not going to put too much faith in my chart-interpreting abilities but Advanced Micro Devices stock does look like a falling-knife scenario. But what’s fascinating is that the market may have already provided a clue as to our current juncture.

Back in early July, I discussed the trading narrative for AMD rival NVIDIA (NASDAQ: NVDA). Specifically, I mentioned that I was intrigued by the 205/210 bull call spread expiring Aug. 7. Now, unless a miracle happens, this trade will almost certainly get blown up (in a bad way). But keep in mind that up until the close of July 22, this trade was very much in the money.

Just as importantly, take a look at the Markov simulator that I provided in that article. Because NVDA stock was projected to decline in performance in the fifth week following the flashing of the underlying quantitative signal, I chose the Aug. 7 expiration date to cut off my exposure. Unfortunately, reality pushed up projected events to week 3 — but the key takeaway is that the downturn did eventually come.

For AMD Stock, It’s Not About Storytelling but Data


Generally, it’s understood that you can’t precisely predict future market behaviors. For decades, if not centuries, analysts have attempted to scour financial prints, technical charts and more recently, quantitative models to predict where a target security may head next. In arguably most cases, these efforts are nothing more than marketing BS.

However, that doesn’t mean we should give up on the idea of probabilistic forecasting. Just like in the NVIDIA case above, I can’t tell you exactly where AMD stock is going to land with absolute certainty. If I did, I certainly wouldn’t share it with anyone. Instead, I would simply trade this proprietary intelligence and basically print my own money.

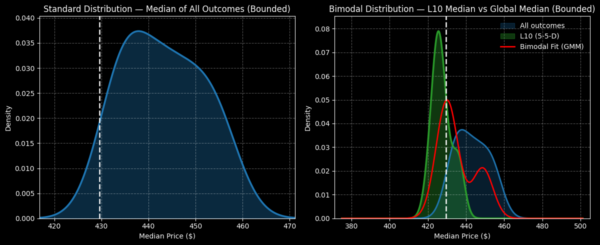
I don’t know where exactly Advanced Micro Devices stock will end up. No one does. But I can tell you — thanks to my Markov simulator — where AMD has historically ended up given specific quantitative conditions.
AMD-StockEarnings

With NVIDIA, the ticker printed four up weeks over the past 10 weeks, leading to a downward slope. Under this 4-6-D sequence, the next five weeks typically resulted in upside, with the next five weeks usually seeing choppy pessimism. Of course, the laws of nature are not guaranteed to repeat, but the above scenario has been the median response.

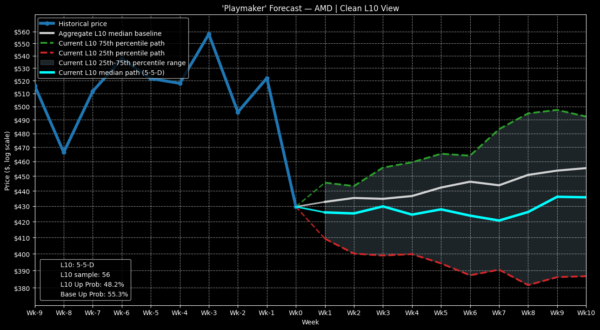
Let’s consider AMD stock. In the past 10 weeks, the ticker has witnessed a 50/50 split between positive and negative sessions; however, the overall slope has been negative. Under this 5-5-D sequence, the statistical expectation is for the median share price to gradually decline to the end of week 7. Then, over the next three weeks, shares tend to pop higher.
AMD-StockEarnings

Still, the lift would be considered modest relative to how AMD stock usually performs as an aggregate expectation. In other words, if you were bullish on Advanced Micro, you’d be better off waiting as the expected performance under the signal is likely going to be worse than the performance under a random hold.

Don’t Believe Me? Check Out the Volatility Skew

It’s not just the historical data that is clouding the case for Advanced Micro Devices stock; rather, it’s the current hedging behavior among smart money traders.

Take a look at the volatility skew for Sep. 18 options chain. Here, the implied volatility (IV) — or the expectation of market movement — for far out-the-money (OTM) puts stands at an astronomical 1,000%. On the other end of the scale, the IV for far OTM calls is only 88.48%. In laymen’s terms, options traders are heavily prioritizing downside protection over upside convexity.

Granted, no one who studies options-based transactions is surprised by the stark picture in the volatility surface. As I mentioned at the top of this article, AMD stock has suffered heavy losses in recent sessions. If the smart money felt that this was a discounted opportunity, you’d likely see call IV elevated. After all, if most folks are selling, this would be a cheap time to buy in volatility terms.

However, the smart money doesn’t view AMD stock as a discount — they view it as a falling knife that is liable to lacerate unsuspecting bulls who do not look at the data. And that’s the overarching point here. I don’t know jack about the markets, seriously. But what I do know are numbers.

Look, I’m not saying be near-term bearish on Advanced Micro Devices stock because that’s how I interpret the charts. I personally don’t know where AMD is going to go. I’m just saying the data, under the specific condition that I outlined, tends to demonstrate negative performance before a turnaround occurs.

If you want to heed the warning, great. If you have an alternative model that suggests differently, use that instead. I’m just showing you the cards that I’m working with and why I believe what I believe.

How Should We Approach Advanced Micro Devices Stock?

From a conservative standpoint, the takeaway from the above data and inductive analysis is to wait until a little after mid-September to reengage AMD stock. Of course, nobody knows exactly how circumstances will pan out. But based on prior trends, that would be the forecasted time period when AMD may start looking interesting for the bulls again.

For those who actively want to speculate, you may consider the 430/420 bear put spread expiring Sep. 18. No, it’s not the most exciting trade because the maximum payout for AMD stock falling through the $420 strike at expiration is only around 53%. Plus, the net debit per spread is a pricey $655. That’s a direct consequence of the hedging activity that has made put options very expensive.

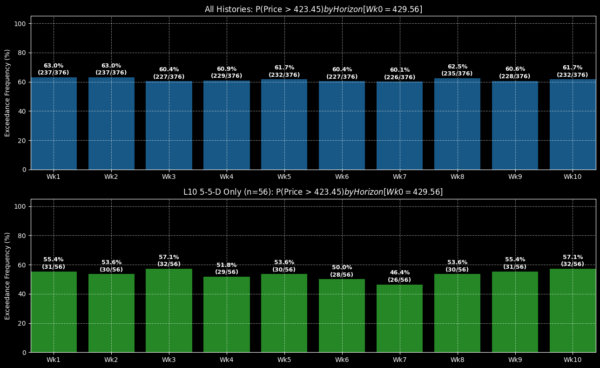
However, what’s enticing here is the breakeven price of $423.45. Right now, Wall Street assigns a probability of profit of 48%. However, the actual odds could be a little bit higher.
AMD-StockEarnings

Since January 2019, the 5-5-D sequence has flashed 56 times on a rolling basis. Of this count, there have been 26 instances where AMD stock has ended up above the $423.45 breakeven price at week 7 (Sep. 18), meaning that there have been 30 cases where AMD slipped below this threshold. As such, the conditional probability of profit could be 53.6%, not 48%.

Granted, that’s not much of a difference relative to Wall Street’s odds. But you also have to consider that being bearish on Advanced Micro Devices stock is no longer the contrarian wager — it’s the expected outcome. So, the bottom line is, if you’re going to be bearish, be prepared to pay. Otherwise, if you’re looking for a discount, you statistically stand a better chance of waiting.


Joshua Enomoto is a seasoned financial writer with a strong track record of in-depth stock analysis, offering clear, insightful commentary for retail investors across all levels of expertise. Renowned for his ability to blend analytical rigor with engaging wit, Joshua's work has been featured on leading investment platforms, including TipRanks, InvestorPlace, Barchart, Benzinga, and Fintel. He was also handpicked to spearhead high-impact initiatives such as InvestorPlace's "Trade of the Day" and Benzinga’s ETF coverage. As a frequent guest expert for CGTN America, Joshua discusses a wide range of economic, societal, and consumer market trends. A graduate of U.C. San Diego, Joshua brings a thoughtful and fresh perspective to complex financial narratives, helping enterprise clients connect with their audiences. He also composes music in his spare time.

Join over 1.2M+ investors/traders who receive daily and weekly notable earnings alerts with predicted move