ajax loader

Loading...


Ride-the-Wave Strategy – Best for Stock Traders

Ride-the-Wave targets multi-day price momentum following a company’s earnings announcement (EA). With this strategy:

  1. Buy a stock one day post-EA if a stock reacts positively post-earnings:
    1. Near the close of trading the EA-day for a pre-market-EA
    2. Near the close of the following day for a post-market-EA
  2. Sell-to-close after 7-10 days, or possibly earlier if a desired price target is reached

Similarly,

  1. short a stock one day post-EA if a stock reacts negatively post-earnings:
    1. near the close of trading the EA-day for a premarket-EA
    2. near the close of the following day for a post-market-EA
  2. then buy-to-close after 7-10 days, or possibly earlier if a desired price target is reached

Important: Ride-the-Wave is predicated on significant price momentum triggered by an EA. The 7-10 day scenario is the maximum trade hold-time. If you see post EA-momentum is halted or reversed by a significant opposite move, re-evaluate your presence in the trade.

This popular StockEarnings screen below will give you a list of stocks that historically exhibit significant price momentum following an EA for the next seven days:

  1. Stocks exhibiting positive post-EA price moves are buy-candidates
  2. Stocks exhibiting negative post-EA price moves are sell/short-candidates

The screen includes those stocks whose Earnings just came out in last two days.

Screen criteria:

  1. Earnings Date Start Date : Current Date + -1 Day
  2. Earnings Date End Date : Current Date + -2 Days
  3. Predicted Move (Next Day) Max : 7%
  4. Predicted Move (On 7th Day) Min : 7%

Strategy Guideline:

  1. Buy the stock if stock has reacted positively. Short the stock if stock has reacted negatively (see above).
  2. Close the position in 7-10 days, or possibly earlier based on price move.

Volatility Crush Strategy - Best for Options Traders

The Volatility Crush strategy is used with stocks that typically experience relatively low-to-moderate price moves (≤4%) following their Earnings Announcements (EA). The basic trade idea is to sell put or call options right before the EA, collecting a credit when options premium is very high due to elevated implied volatility (IV). You then close the position right after the EA by buying the option back much cheaper due to the significant drop in IV that occurs after the mystery of the EA disappears. In assessing this trade, you need to do your homework to ensure you collect sufficient premium to make the trade worthwhile.

This trade is practical due to the low-to-moderate price-move after the EA, which generally won’t significantly affect the options price, unlike an “action” stock, which experience great price moves post-EA. With these symbols, if you’re on the right side of the price move, that’s a great thing. But if you’re on the wrong side of the move, not so great. Consequently, by minimizing the effect of the post-EA price move, you have a much better chance to profit from the reduction in IV without it being ruined by a violent price move.

For this trade, open the position either (1) the night before the EA when the company announces earnings or (2) during the EA day when it announces post-market, generally capturing IV at or close to its peak.

For this trade, open the position either (1) the night before the EA when the company announces earnings or (2) during the EA day when it announces post-market, generally capturing IV at or close to its peak.

This popular stockearnings screen will give you a list of stocks which do not react more than 4% fpost-EA. It includes only those stocks whose earnings are releasing next day.

Screen criteria:

  1. Earnings Date Start Date : Current Date + 1
  2. Earnings Date End Date : Current Date + 1
  3. Predicted Move (Next Day) Max : 4%
  4. Options Type: Weekly

Strategy Guideline:

  1. Options Strategy: Sell Call and Put
  2. Options Strike Price: Current Stock Price – (% Predicated Move x 2)
  3. Expiration Date: It should generally be the closest expiry immediately after the EA.
  4. Buy Insurance: Buying back Call and Put at Strike price which 10% lower than Sell Strike Price is optional but recommended.

Watch Video for More Detail

Volatility Rush Strategy - Best for Options Traders

The Volatility Rush takes advantage of increasing options premiums into earnings announcements (EA) caused by an anticipated rise in Implied Volatility (IV). With this strategy, Buy a Call and Put at-the-money (a long straddle) 2-3 weeks before the EA when IV is lower. Sell the position either (1) the night before the EA when the company announces earnings pre-market, or (2) during the EA day when it announces post-market, generally capturing IV at or close to its peak.

This popular screen will give you a list of stocks whose Options premiums tend to rise into Earnings. It includes only those stocks whose Earnings are at least two weeks away from today.

Screen criteria:

  1. Earnings Date Start Date : Current Date + 15 Days
  2. Earnings Date End Date : Current Date + 30 Days
  3. Predicted Move (Next Day) Min : 5%
  4. Options Type: Weekly or Monthly if that lines up with the two to three-week lead-time for entering the trade

Strategy Guideline:

  1. Buy a Straddle at or close to the money two to three weeks pre-EA.
  2. Sell the position either the night before the EA when the company announces earnings pre-market, or during the EA day when it announces post-market.
  3. Expiration date should generally be the closest expiry immediately after the EA.
  4. Straddle price should not be more 60% of predicted move.

Predicted Move (Volatility)

Similar to Implied Volatility in Options. Expected volatility % based on our Proprietary Volatility Predication Model. We are expecting that stock price will likely to reach % in either direction by the end of next trading session after Earnings are released and not necessarily the closing volatility %.

Why is it important?

    This indicator helps

  1. Knowing expected volatility in stocks after Earnings helps to decide trading stocks before Earnings Announcement.
  2. Taking Advantage of volatility collapse following Earnings Results by using Advance Options strategies such as Spread and Straddles.

Since Last Earnings

Change in share price since last Earnings release.

Why is it Important?

When share has gained more than 10% since it's last Earning release, it tends to over react to minor bad news and give up some gains if not all. So, it contains more downside volatility than upside When share has dropped more than 10% since it's last Earning release, it tends to over react to minor good news and recover some drops if not all. So, it contains more upside volatility than downside.

EPS Surprise (%)

Occurs when a company's reported quarterly or annual profits are above or below analysts' expectations. Here is the formula to derive % EPS Surprice:

Actual EPS - Estimated EPS
------------------------------------- x 100
Estimated EPS

Why is it Important?

Earnings surprises can have a huge impact on a company's stock price. Several studies suggest that positive earnings surprises not only lead to an immediate hike in a stock's price, but also to a gradual increase over time. Hence, it's not surprising that some companies are known for routinely beating earning projections. A negative earnings surprise will usually result in a decline in share price.

Next Day Price Change (%)

Next Regular trading session Closing price following Earnings result.

For After Market Close Earnings, It is a next trading day closing price. For Before Market Open Earnings, It is the same trading day closing price.

Why is it Important?

Next Day price change is a reaction of Earnings result.

How Long Can Meta Run On Vision And Ideas?

Posted on Jul 31, 2026 by Grayson Cavern

How Long Can Meta Run On Vision And Ideas?

Vision always gets sold first. That’s what investors buy into. The promise of a bigger future, a larger market, a revolutionary product. But after a while, execution decides whether they keep buying… or quietly head for the exit.

That’s the thought I couldn’t shake after reading Meta Platforms (NASDAQ: META)‘s second-quarter earnings.

A few days ago, I wrote that I wasn’t looking for another ambitious AI vision from Mark Zuckerberg. Revenue and EPS were never going to settle the debate. What I wanted was specificity – a named business, a monetization roadmap, something concrete that proved Meta’s AI infrastructure was beginning to evolve from a massive cost center into a measurable revenue engine.

I didn’t get that. Instead, Meta reported another excellent advertising quarter. Revenue climbed 28% to $60.8 billion, easily demonstrating that the core business remains one of the strongest cash-generating machines on the planet. Yet earnings per share fell 13% to $6.18, operating margin contracted from 43% to 31%, and the stock responded by erasing roughly 10% of its value overnight. And now, investors are beginning to question how much longer they’re expected to finance it before seeing something more tangible.

CAPEX Is Smothering Meta’s Cash Machine


One thing became obvious as I worked through the earnings release. The business is producing more cash than ever, yet shareholders are seeing less of it.

Yeah, it was an outstanding quarter as revenue climbed 28% to $60.8 billion, daily active people reached 3.60 billion, ad impressions increased 14%, and the average price per ad rose another 12%. AI is clearly making Meta’s core products more engaging and more valuable to advertisers. On that front, Zuckerberg deserves credit…until the financial statements take a sharp turn.

Capital expenditures reached $31.08 billion during the quarter, almost matching the $31.86 billion generated from operating activities. The result was free cash flow of just $784 million, down dramatically from $8.55 billion in the same quarter last year. At the same time, operating margin compressed from 43% to 31%, while earnings per share fell 13% despite the surge in revenue..

None of those investments are difficult to understand. The market knows Meta is building AI infrastructure at a pace few companies can match. However, it has failed to answer my questions before the earnings;  when does all of this stop looking like investment and start looking like a new, money-making business? Because until investors can point to a product, a revenue stream or a commercial timeline that connects today’s spending with tomorrow’s returns, every additional billion dollars risks feeling less like progress and more like another promise.

Even Patient Investors Eventually Get Tired

For the better part of three years, shareholders have been asked to look beyond today’s numbers and focus on tomorrow’s possibilities. First it was the metaverse. Then generative AI. Now it’s the next wave of opportunities those investments are expected to unlock. Each quarter extends the timeline just a little further, while asking investors to remain just as convinced as they were before.

That bargain becomes harder to accept with time. The market can be forgiving when it believes a destination is getting closer. It becomes far less generous when every milestone feels like another sign pointing to a place that’s still miles away. That’s why this earnings reaction felt different to me. I didn’t see investors rejecting Meta’s vision. I saw them growing weary of waiting for the vision to become something they could measure.

I came across one investor who summed it up better than any earnings model could. “Meta can’t keep asking shareholders to buy another idea. Eventually, the ideas have to start introducing themselves as businesses”. And that’s exactly the mood every bull is wrestling with today – the quiet, longing exhaustion that comes from believing in a story for so long that you begin checking your watch instead of the horizon.

The Chart Is Waiting For Zuckerberg Too

Meta’s fundamentals and its stock have been telling two different stories for months.

Since February, every meaningful rally has run into the same descending trendline before losing momentum. Buyers keep showing up, but they haven’t shown up with enough conviction to change the trend. The latest earnings reaction only reinforced that pattern. The stock gapped nearly 10% lower, lost both its 20-day and 50-day moving averages, and once again found itself leaning on a rising support trendline that’s been holding the longer-term uptrend together.

If investors had genuinely concluded Meta’s spending spree was a mistake, I’d expect a far uglier technical picture. Instead, every sharp decline over the past six months has eventually attracted buyers, while every rally has run into sellers asking for the same thing: proof. The result is a stock trapped between optimism and evidence.

Sooner or later, one side wins. If Zuckerberg starts connecting today’s investment with tomorrow’s revenue in a way the market can actually measure, this chart has plenty of room to resolve higher. If not, another quarter of exceptional vision may simply produce another quarter of exceptional patience.
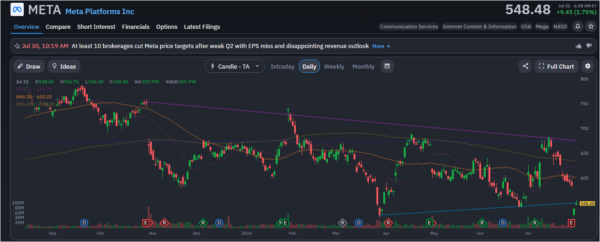
META-StockEarnings

At this point, long-term Meta investors probably deserve a support group. Every quarter asks them to fund another ambitious idea while waiting for the last one to mature.

Don’t get me wrong, Meta is still a great business. And great businesses sometimes frustrate shareholders before they reward them. But after this quarter, I completely understand why investors are becoming restless. At some point, the market stops applauding another brilliant vision and starts asking to see the invoice. Until Zuckerberg replaces possibility with proof, I suspect patience – not advertising – will remain Meta’s most valuable asset.


Join over 1.2M+ investors/traders who receive daily and weekly notable earnings alerts with predicted move