ajax loader

Loading...


Ride-the-Wave Strategy – Best for Stock Traders

Ride-the-Wave targets multi-day price momentum following a company’s earnings announcement (EA). With this strategy:

  1. Buy a stock one day post-EA if a stock reacts positively post-earnings:
    1. Near the close of trading the EA-day for a pre-market-EA
    2. Near the close of the following day for a post-market-EA
  2. Sell-to-close after 7-10 days, or possibly earlier if a desired price target is reached

Similarly,

  1. short a stock one day post-EA if a stock reacts negatively post-earnings:
    1. near the close of trading the EA-day for a premarket-EA
    2. near the close of the following day for a post-market-EA
  2. then buy-to-close after 7-10 days, or possibly earlier if a desired price target is reached

Important: Ride-the-Wave is predicated on significant price momentum triggered by an EA. The 7-10 day scenario is the maximum trade hold-time. If you see post EA-momentum is halted or reversed by a significant opposite move, re-evaluate your presence in the trade.

This popular StockEarnings screen below will give you a list of stocks that historically exhibit significant price momentum following an EA for the next seven days:

  1. Stocks exhibiting positive post-EA price moves are buy-candidates
  2. Stocks exhibiting negative post-EA price moves are sell/short-candidates

The screen includes those stocks whose Earnings just came out in last two days.

Screen criteria:

  1. Earnings Date Start Date : Current Date + -1 Day
  2. Earnings Date End Date : Current Date + -2 Days
  3. Predicted Move (Next Day) Max : 7%
  4. Predicted Move (On 7th Day) Min : 7%

Strategy Guideline:

  1. Buy the stock if stock has reacted positively. Short the stock if stock has reacted negatively (see above).
  2. Close the position in 7-10 days, or possibly earlier based on price move.

Volatility Crush Strategy - Best for Options Traders

The Volatility Crush strategy is used with stocks that typically experience relatively low-to-moderate price moves (≤4%) following their Earnings Announcements (EA). The basic trade idea is to sell put or call options right before the EA, collecting a credit when options premium is very high due to elevated implied volatility (IV). You then close the position right after the EA by buying the option back much cheaper due to the significant drop in IV that occurs after the mystery of the EA disappears. In assessing this trade, you need to do your homework to ensure you collect sufficient premium to make the trade worthwhile.

This trade is practical due to the low-to-moderate price-move after the EA, which generally won’t significantly affect the options price, unlike an “action” stock, which experience great price moves post-EA. With these symbols, if you’re on the right side of the price move, that’s a great thing. But if you’re on the wrong side of the move, not so great. Consequently, by minimizing the effect of the post-EA price move, you have a much better chance to profit from the reduction in IV without it being ruined by a violent price move.

For this trade, open the position either (1) the night before the EA when the company announces earnings or (2) during the EA day when it announces post-market, generally capturing IV at or close to its peak.

For this trade, open the position either (1) the night before the EA when the company announces earnings or (2) during the EA day when it announces post-market, generally capturing IV at or close to its peak.

This popular stockearnings screen will give you a list of stocks which do not react more than 4% fpost-EA. It includes only those stocks whose earnings are releasing next day.

Screen criteria:

  1. Earnings Date Start Date : Current Date + 1
  2. Earnings Date End Date : Current Date + 1
  3. Predicted Move (Next Day) Max : 4%
  4. Options Type: Weekly

Strategy Guideline:

  1. Options Strategy: Sell Call and Put
  2. Options Strike Price: Current Stock Price – (% Predicated Move x 2)
  3. Expiration Date: It should generally be the closest expiry immediately after the EA.
  4. Buy Insurance: Buying back Call and Put at Strike price which 10% lower than Sell Strike Price is optional but recommended.

Watch Video for More Detail

Volatility Rush Strategy - Best for Options Traders

The Volatility Rush takes advantage of increasing options premiums into earnings announcements (EA) caused by an anticipated rise in Implied Volatility (IV). With this strategy, Buy a Call and Put at-the-money (a long straddle) 2-3 weeks before the EA when IV is lower. Sell the position either (1) the night before the EA when the company announces earnings pre-market, or (2) during the EA day when it announces post-market, generally capturing IV at or close to its peak.

This popular screen will give you a list of stocks whose Options premiums tend to rise into Earnings. It includes only those stocks whose Earnings are at least two weeks away from today.

Screen criteria:

  1. Earnings Date Start Date : Current Date + 15 Days
  2. Earnings Date End Date : Current Date + 30 Days
  3. Predicted Move (Next Day) Min : 5%
  4. Options Type: Weekly or Monthly if that lines up with the two to three-week lead-time for entering the trade

Strategy Guideline:

  1. Buy a Straddle at or close to the money two to three weeks pre-EA.
  2. Sell the position either the night before the EA when the company announces earnings pre-market, or during the EA day when it announces post-market.
  3. Expiration date should generally be the closest expiry immediately after the EA.
  4. Straddle price should not be more 60% of predicted move.

Predicted Move (Volatility)

Similar to Implied Volatility in Options. Expected volatility % based on our Proprietary Volatility Predication Model. We are expecting that stock price will likely to reach % in either direction by the end of next trading session after Earnings are released and not necessarily the closing volatility %.

Why is it important?

    This indicator helps

  1. Knowing expected volatility in stocks after Earnings helps to decide trading stocks before Earnings Announcement.
  2. Taking Advantage of volatility collapse following Earnings Results by using Advance Options strategies such as Spread and Straddles.

Since Last Earnings

Change in share price since last Earnings release.

Why is it Important?

When share has gained more than 10% since it's last Earning release, it tends to over react to minor bad news and give up some gains if not all. So, it contains more downside volatility than upside When share has dropped more than 10% since it's last Earning release, it tends to over react to minor good news and recover some drops if not all. So, it contains more upside volatility than downside.

EPS Surprise (%)

Occurs when a company's reported quarterly or annual profits are above or below analysts' expectations. Here is the formula to derive % EPS Surprice:

Actual EPS - Estimated EPS
------------------------------------- x 100
Estimated EPS

Why is it Important?

Earnings surprises can have a huge impact on a company's stock price. Several studies suggest that positive earnings surprises not only lead to an immediate hike in a stock's price, but also to a gradual increase over time. Hence, it's not surprising that some companies are known for routinely beating earning projections. A negative earnings surprise will usually result in a decline in share price.

Next Day Price Change (%)

Next Regular trading session Closing price following Earnings result.

For After Market Close Earnings, It is a next trading day closing price. For Before Market Open Earnings, It is the same trading day closing price.

Why is it Important?

Next Day price change is a reaction of Earnings result.

NVIDIA Stock is Down 11% in the Past Month: Is Now a Good Time to Buy?

Posted on Jul 03, 2026 by Joshua Enomoto

NVIDIA Stock is Down 11% in the Past Month: Is Now a Good Time to Buy?

As one of the flagship names of artificial intelligence, NVIDIA (NASDAQ: NVDA) really needs no introduction. And because it’s incredibly relevant to the broader innovation space, any downturn in NVDA stock is likely to be viewed as a contrarian opportunity. Given that the security has declined by more than 11% in the trailing month, the red ink poses an enticing question: is now a good time to buy?

Invariably, the financial publication space will attempt to answer this question through fundamental analysis. However, I believe this methodology has significant constraints. Rather than attempting to extract the long-term investment value of NVDA stock, I prefer to focus on short-term exposure via the options market. To provide a quantitative roadmap, I’ll be using a process known as non-parametric conditional sequence simulation or path-dependent conditioning.

Why Not Discuss the Fundamentals for NVDA Stock?


Before getting into the good stuff, I’ll quickly explain why I’m not particularly keen on fundamental analysis — at least the way that it’s commonly practiced in the finpub space.

Primarily, the bullish case for NVIDIA stock centers on the multi-token inference economy and platform lock-in. While it’s true that skeptics have focused on the leveling off in initial large-language-model (LLM) training clusters, those with a glass-half-full perspective are pointing to NVIDIA’s transition toward the emerging agentic AI segment.

Notably, NVIDIA is leveraging its software moat to help enterprises deploy real-time autonomous agents. Moreover, the semiconductor giant is rigorously expanding its architecture to address memory bandwidth bottlenecks. Here, its deployment of ultra-high-speed inference platforms targets real-time, low-latency token throughput. Subsequently, this move ensures that even if training demand moderates, the sheer volume of computing required to run millions of active agentic systems globally sustains hardware demand.

There are many other positive catalysts for NVDA stock, such as hardware efficiency improvements and a massive revenue pipeline for its key products. Further, nation-states are building out domestic data centers to ensure data-localized independence, bolstering the company’s long-standing relevance.

I could go on and on but none of this information above provides any edge. That’s because — unless there’s evidence to suggest otherwise — all these catalysts have been fully reflected in the NVDA stock price.

And that’s honestly the core reason why I don’t want to waste too much time on NVIDIA’s fundamentals. NVDA stock is one of the most heavily traded securities in the world. I highly doubt that major banks, institutional investors and algorithmically enhanced hedge funds forgot to incorporate the good news into NVDA — but somehow Bob from Arkansas saw something that nobody else did.

What About Unusual Options Activity for NVIDIA Stock?

Some of the more advanced finpubs will often discuss unusual options activity as a basis for exposure to NVDA stock. The premise goes that because the smart money is buying up large blocks of NVIDIA call options, the open market will eventually follow suit with a positive rerating of shares.

That’s not how options work. For one thing, every transaction in the derivatives market has a counterparty; in other words, if someone is buying calls, there’s another person selling them. Options can’t be transacted in the ether. It’s misleading to label derivatives trading as a net bullish or net bearish because the options market is a zero-sum game.

What’s more, trading unusual options activity for NVDA stock could be a detrimental way to go about your business. By the time that big block of orders has hit the options screener, the underlying market maker has hedged the order to remain delta-neutral. This hedging creates a spike in implied volatility for the affected strike price.

Basically, if you buy the exact same option that is flashing as unusual, you are buying it at a heightened volatility premium. What finpubs don’t tell you — because it would obviously hurt their retention — is that you need to trade options before they become unusual.

Other than pure speculation, there’s no telling when an order will become unusual. So, we need to rethink the whole game.

Asking the Right Question

Everything begins by asking the right question. For those seeking a quick profit from Nvidia stock, the question is as follows: what is the expected performance of NVDA if I were to buy shares randomly (i.e. without timing the market)?

Using a dataset going back to January 2019, we can calculate that if you bought NVDA stock today (at $197.58) and held it for 10 weeks, your median forward distribution would land roughly between $190 and $230. Probability density will peak at around $215, implying an upward bias. As this is our random baseline, any trading signal that we’re interested in must consistently beat this performance; otherwise, there’s no incentive to trade.

NVIDIA-StockEarnings

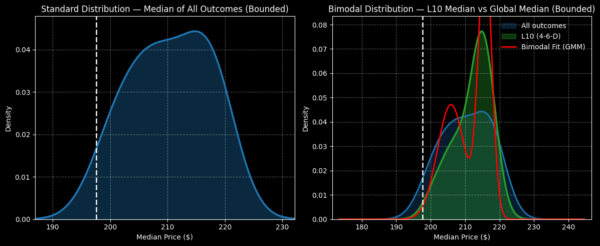
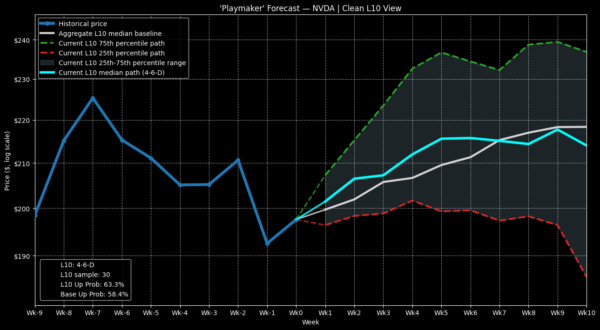
As mentioned earlier, NVDA stock is suffering from a bearish cycle. From a weekly candlestick perspective, in the last 10 weeks, NVDA printed only four up weeks, leading to an overall downward slope. Conditioned for this 4-6-D sequence, the expected forward distribution over the next 10 weeks comes out to between $190 and $230. Probability density also peaks at around $215, which doesn’t give much variance from the baseline.

From these stats, it’s easy to dismiss NVDA stock. However, on a week-by-week basis, the median pathway of NVDA following the 4-6-D signal tends to lift higher than the baseline pathway over the next five to six weeks. Therefore, if this inference rings true, a near-expiry options trade could be lucrative.

Identifying a Tempting Trade

For aggressive speculators, I’d take a look at the 205/210 bull call spread expiring Aug. 7. If the aforementioned signal’s observed median pathway holds true, the $210 strike would represent a realistic target at expiration. Should the trade pan out, the maximum payout would be over 156%.

NVIDIA-StockEarnings

Of course, the caveat with pattern recognition is that there’s no necessary reason for the trend to materialize as expected. Stated differently, just because you see something happen a hundred times does not mean the 101st time will yield a similar result. That’s the black swan risk of inductive methodologies.

At the same time, without induction, we’re left with just guessing where NVDA stock will head next. I find that to be an intellectually unsatisfying process, which is why I’ll continue to focus on path-dependent conditioning.

Joshua Enomoto is a seasoned financial writer with a strong track record of in-depth stock analysis, offering clear, insightful commentary for retail investors across all levels of expertise. Renowned for his ability to blend analytical rigor with engaging wit, Joshua's work has been featured on leading investment platforms, including TipRanks, InvestorPlace, Barchart, Benzinga, and Fintel. He was also handpicked to spearhead high-impact initiatives such as InvestorPlace's "Trade of the Day" and Benzinga’s ETF coverage. As a frequent guest expert for CGTN America, Joshua discusses a wide range of economic, societal, and consumer market trends. A graduate of U.C. San Diego, Joshua brings a thoughtful and fresh perspective to complex financial narratives, helping enterprise clients connect with their audiences. He also composes music in his spare time.

Join over 1.2M+ investors/traders who receive daily and weekly notable earnings alerts with predicted move