ajax loader

Loading...


Ride-the-Wave Strategy – Best for Stock Traders

Ride-the-Wave targets multi-day price momentum following a company’s earnings announcement (EA). With this strategy:

  1. Buy a stock one day post-EA if a stock reacts positively post-earnings:
    1. Near the close of trading the EA-day for a pre-market-EA
    2. Near the close of the following day for a post-market-EA
  2. Sell-to-close after 7-10 days, or possibly earlier if a desired price target is reached

Similarly,

  1. short a stock one day post-EA if a stock reacts negatively post-earnings:
    1. near the close of trading the EA-day for a premarket-EA
    2. near the close of the following day for a post-market-EA
  2. then buy-to-close after 7-10 days, or possibly earlier if a desired price target is reached

Important: Ride-the-Wave is predicated on significant price momentum triggered by an EA. The 7-10 day scenario is the maximum trade hold-time. If you see post EA-momentum is halted or reversed by a significant opposite move, re-evaluate your presence in the trade.

This popular StockEarnings screen below will give you a list of stocks that historically exhibit significant price momentum following an EA for the next seven days:

  1. Stocks exhibiting positive post-EA price moves are buy-candidates
  2. Stocks exhibiting negative post-EA price moves are sell/short-candidates

The screen includes those stocks whose Earnings just came out in last two days.

Screen criteria:

  1. Earnings Date Start Date : Current Date + -1 Day
  2. Earnings Date End Date : Current Date + -2 Days
  3. Predicted Move (Next Day) Max : 7%
  4. Predicted Move (On 7th Day) Min : 7%

Strategy Guideline:

  1. Buy the stock if stock has reacted positively. Short the stock if stock has reacted negatively (see above).
  2. Close the position in 7-10 days, or possibly earlier based on price move.

Volatility Crush Strategy - Best for Options Traders

The Volatility Crush strategy is used with stocks that typically experience relatively low-to-moderate price moves (≤4%) following their Earnings Announcements (EA). The basic trade idea is to sell put or call options right before the EA, collecting a credit when options premium is very high due to elevated implied volatility (IV). You then close the position right after the EA by buying the option back much cheaper due to the significant drop in IV that occurs after the mystery of the EA disappears. In assessing this trade, you need to do your homework to ensure you collect sufficient premium to make the trade worthwhile.

This trade is practical due to the low-to-moderate price-move after the EA, which generally won’t significantly affect the options price, unlike an “action” stock, which experience great price moves post-EA. With these symbols, if you’re on the right side of the price move, that’s a great thing. But if you’re on the wrong side of the move, not so great. Consequently, by minimizing the effect of the post-EA price move, you have a much better chance to profit from the reduction in IV without it being ruined by a violent price move.

For this trade, open the position either (1) the night before the EA when the company announces earnings or (2) during the EA day when it announces post-market, generally capturing IV at or close to its peak.

For this trade, open the position either (1) the night before the EA when the company announces earnings or (2) during the EA day when it announces post-market, generally capturing IV at or close to its peak.

This popular stockearnings screen will give you a list of stocks which do not react more than 4% fpost-EA. It includes only those stocks whose earnings are releasing next day.

Screen criteria:

  1. Earnings Date Start Date : Current Date + 1
  2. Earnings Date End Date : Current Date + 1
  3. Predicted Move (Next Day) Max : 4%
  4. Options Type: Weekly

Strategy Guideline:

  1. Options Strategy: Sell Call and Put
  2. Options Strike Price: Current Stock Price – (% Predicated Move x 2)
  3. Expiration Date: It should generally be the closest expiry immediately after the EA.
  4. Buy Insurance: Buying back Call and Put at Strike price which 10% lower than Sell Strike Price is optional but recommended.

Watch Video for More Detail

Volatility Rush Strategy - Best for Options Traders

The Volatility Rush takes advantage of increasing options premiums into earnings announcements (EA) caused by an anticipated rise in Implied Volatility (IV). With this strategy, Buy a Call and Put at-the-money (a long straddle) 2-3 weeks before the EA when IV is lower. Sell the position either (1) the night before the EA when the company announces earnings pre-market, or (2) during the EA day when it announces post-market, generally capturing IV at or close to its peak.

This popular screen will give you a list of stocks whose Options premiums tend to rise into Earnings. It includes only those stocks whose Earnings are at least two weeks away from today.

Screen criteria:

  1. Earnings Date Start Date : Current Date + 15 Days
  2. Earnings Date End Date : Current Date + 30 Days
  3. Predicted Move (Next Day) Min : 5%
  4. Options Type: Weekly or Monthly if that lines up with the two to three-week lead-time for entering the trade

Strategy Guideline:

  1. Buy a Straddle at or close to the money two to three weeks pre-EA.
  2. Sell the position either the night before the EA when the company announces earnings pre-market, or during the EA day when it announces post-market.
  3. Expiration date should generally be the closest expiry immediately after the EA.
  4. Straddle price should not be more 60% of predicted move.

Predicted Move (Volatility)

Similar to Implied Volatility in Options. Expected volatility % based on our Proprietary Volatility Predication Model. We are expecting that stock price will likely to reach % in either direction by the end of next trading session after Earnings are released and not necessarily the closing volatility %.

Why is it important?

    This indicator helps

  1. Knowing expected volatility in stocks after Earnings helps to decide trading stocks before Earnings Announcement.
  2. Taking Advantage of volatility collapse following Earnings Results by using Advance Options strategies such as Spread and Straddles.

Since Last Earnings

Change in share price since last Earnings release.

Why is it Important?

When share has gained more than 10% since it's last Earning release, it tends to over react to minor bad news and give up some gains if not all. So, it contains more downside volatility than upside When share has dropped more than 10% since it's last Earning release, it tends to over react to minor good news and recover some drops if not all. So, it contains more upside volatility than downside.

EPS Surprise (%)

Occurs when a company's reported quarterly or annual profits are above or below analysts' expectations. Here is the formula to derive % EPS Surprice:

Actual EPS - Estimated EPS
------------------------------------- x 100
Estimated EPS

Why is it Important?

Earnings surprises can have a huge impact on a company's stock price. Several studies suggest that positive earnings surprises not only lead to an immediate hike in a stock's price, but also to a gradual increase over time. Hence, it's not surprising that some companies are known for routinely beating earning projections. A negative earnings surprise will usually result in a decline in share price.

Next Day Price Change (%)

Next Regular trading session Closing price following Earnings result.

For After Market Close Earnings, It is a next trading day closing price. For Before Market Open Earnings, It is the same trading day closing price.

Why is it Important?

Next Day price change is a reaction of Earnings result.

Verizon Stock: Solid Dividend Pick for a Shifting Market

Posted on Jul 27, 2026 by Chris Markoch

Verizon Stock: Solid Dividend Pick for a Shifting Market

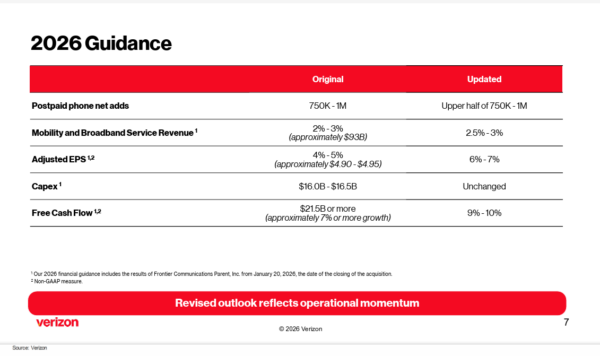
Verizon Communications (NYSE: VZ) stock is finding its moment again. After a brutal multi-year slide, VZ stock looks like the right pick for the right time. The company’s Q2 2026 earnings, released July 24, gave investors two reasons to pay attention. First, Verizon disclosed a dark fiber deal with Alphabet (NASDAQ: GOOGL) worth more than $1 billion, with CEO Dan Schulman promising more deals are coming before year-end. Second, and more important for income investors, Verizon raised its full-year guidance for adjusted EPS growth to 6%-7% and free cash flow growth to 9%-10%.

The latter numbers matter because Verizon is, first and foremost, a dividend stock. The company just marked 20 consecutive years of dividend increases, a streak matched by few companies in any sector. The current yield sits north of 6%, among the highest of any blue-chip name.

That yield becomes particularly significant as high-yield dividend stocks are back in vogue. VZ stock tanked starting in late 2022 for two major reasons. First, rising interest rates made bonds and money-market funds competitive again, pulling capital away from dividend payers.

At the same time, investors chased growth, especially AI names, leaving behind steady utility-like stocks such as Verizon. Now that pendulum is swinging back,, and Verizon looks like an attractive port in a stormy market.

Free Cash Flow Continues to Support Verizon’s 6% Yield


Verizon’s Q2 earnings report provided more evidence that its dividend is backed by real cash generation. In the first half of 2026, the company produced $10.2 billion in free cash flow, up from $8.8 billion a year earlier. That’s a 16% jump. Dividends paid over the same period totaled $5.9 billion, meaning the payout consumed less than 60% of free cash flow.
verizon - StockEarnings

That leaves plenty of room for debt reduction and buybacks. Verizon repurchased $3.5 billion in shares during the first half of 2026, its first buyback activity in years. Total debt did rise to $165.2 billion, largely reflecting the Frontier Communications acquisition. Net unsecured debt to adjusted EBITDA ticked up to 2.5x from 2.3x. That’s a manageable level for a company this size, especially with EBITDA growing.

Adjusted EBITDA hit $13.7 billion in the quarter, up 7.2% year over year and a company record. Adjusted EPS grew 6.6% to $1.30. Management’s guidance upgrade, its second in two consecutive quarters, signals confidence that this momentum can continue through year-end.

Wireless and Broadband Growth Point to Business Stability

As every dividend investor knows, the dividend story only works if the underlying business stays healthy. Verizon’s core wireless numbers provide that support. The company added 184,000 retail postpaid phone net additions in Q2, up 193,000 year over year. Churn improved to 0.92%, down five basis points sequentially. That’s a meaningful signal. Fewer customers are leaving, even as competition from cable and wireless rivals intensifies.

Broadband net adds reached 348,000 for the quarter, continuing a streak of consistent growth aided by the Frontier fiber footprint. Mobility and Broadband Service Revenue rose 2.8% year over year to $23.4 billion.

None of these numbers is explosive. But for a company valued largely on stability and income, steady beats flashy. Management raised its postpaid phone net-add guidance to the upper half of its 750,000-to-1 million range, another sign that subscriber trends are holding up better than expected heading into the back half of 2026.

VZ Stock Breaks Higher as Technical Signals Improve

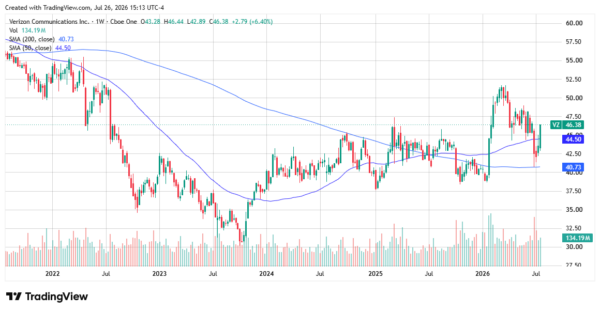
The technical picture supports the fundamental story. VZ shares bottomed near $30 in mid-2023 and have since climbed steadily, closing the week at $46.38, up 6.4%. The 50-week moving average, now at $44.50, has crossed above the 200-week average at $40.73. That’s a bullish long-term signal known as a golden cross.

Shares have also cleared old resistance near $45, a level that capped rallies through much of 2025 and early 2026. Volume picked up sharply on the earnings pop, a sign of institutional buying rather than a routine bounce. The stock still trades well below its 2021 highs above $55, leaving room to run if the AI infrastructure narrative gains traction. Support now sits near the rising 50-week average.
verizon - StockEarnings

Satellite Competition Remains More Hype Than Reality

Direct-to-device satellite connectivity from providers like Starlink and T-Mobile’s partnership with SpaceX draws headlines as a threat to traditional carriers. The concern is that satellites could eventually bypass cell towers entirely for basic connectivity. For now, that threat looks more theoretical than immediate.

Satellite service today handles basic texting and limited data in dead zones, not full broadband or high-capacity mobile use. Verizon’s own churn and net-add numbers this quarter show no signs of customer defection tied to satellite alternatives. The bigger risk to Verizon isn’t satellite stealing subscribers outright, but rather it becoming a complementary feature carriers must license or match. Verizon has already struck its own satellite partnerships to hedge against this. Investors should watch the space, but it isn’t reshaping results yet.

Why Verizon Stock Still Appeals to Income Investors

Verizon’s Q2 report reinforces a simple thesis. This is a dividend stock trading at a moment when dividends are back in style. A 6% yield, 20 years of consecutive increases, and improving free cash flow give investors a defensive core holding. The Google dark fiber deal and the promise of more like it add a growth kicker that didn’t exist in this stock a year ago.

None of this makes Verizon a growth stock. It remains a slow-moving telecom carrying real debt. But for investors seeking safety and income in an uncertain market, Verizon looks to be at the right place at the right time.


A former marketing copywriter turned freelance financial writer and market analyst. I have a passion for delivering insights to investors. I write regularly about stocks for StockEarnings and MarketBeat. Posts are not advice.

Join over 1.2M+ investors/traders who receive daily and weekly notable earnings alerts with predicted move