ajax loader

Loading...


Ride-the-Wave Strategy – Best for Stock Traders

Ride-the-Wave targets multi-day price momentum following a company’s earnings announcement (EA). With this strategy:

  1. Buy a stock one day post-EA if a stock reacts positively post-earnings:
    1. Near the close of trading the EA-day for a pre-market-EA
    2. Near the close of the following day for a post-market-EA
  2. Sell-to-close after 7-10 days, or possibly earlier if a desired price target is reached

Similarly,

  1. short a stock one day post-EA if a stock reacts negatively post-earnings:
    1. near the close of trading the EA-day for a premarket-EA
    2. near the close of the following day for a post-market-EA
  2. then buy-to-close after 7-10 days, or possibly earlier if a desired price target is reached

Important: Ride-the-Wave is predicated on significant price momentum triggered by an EA. The 7-10 day scenario is the maximum trade hold-time. If you see post EA-momentum is halted or reversed by a significant opposite move, re-evaluate your presence in the trade.

This popular StockEarnings screen below will give you a list of stocks that historically exhibit significant price momentum following an EA for the next seven days:

  1. Stocks exhibiting positive post-EA price moves are buy-candidates
  2. Stocks exhibiting negative post-EA price moves are sell/short-candidates

The screen includes those stocks whose Earnings just came out in last two days.

Screen criteria:

  1. Earnings Date Start Date : Current Date + -1 Day
  2. Earnings Date End Date : Current Date + -2 Days
  3. Predicted Move (Next Day) Max : 7%
  4. Predicted Move (On 7th Day) Min : 7%

Strategy Guideline:

  1. Buy the stock if stock has reacted positively. Short the stock if stock has reacted negatively (see above).
  2. Close the position in 7-10 days, or possibly earlier based on price move.

Volatility Crush Strategy - Best for Options Traders

The Volatility Crush strategy is used with stocks that typically experience relatively low-to-moderate price moves (≤4%) following their Earnings Announcements (EA). The basic trade idea is to sell put or call options right before the EA, collecting a credit when options premium is very high due to elevated implied volatility (IV). You then close the position right after the EA by buying the option back much cheaper due to the significant drop in IV that occurs after the mystery of the EA disappears. In assessing this trade, you need to do your homework to ensure you collect sufficient premium to make the trade worthwhile.

This trade is practical due to the low-to-moderate price-move after the EA, which generally won’t significantly affect the options price, unlike an “action” stock, which experience great price moves post-EA. With these symbols, if you’re on the right side of the price move, that’s a great thing. But if you’re on the wrong side of the move, not so great. Consequently, by minimizing the effect of the post-EA price move, you have a much better chance to profit from the reduction in IV without it being ruined by a violent price move.

For this trade, open the position either (1) the night before the EA when the company announces earnings or (2) during the EA day when it announces post-market, generally capturing IV at or close to its peak.

For this trade, open the position either (1) the night before the EA when the company announces earnings or (2) during the EA day when it announces post-market, generally capturing IV at or close to its peak.

This popular stockearnings screen will give you a list of stocks which do not react more than 4% fpost-EA. It includes only those stocks whose earnings are releasing next day.

Screen criteria:

  1. Earnings Date Start Date : Current Date + 1
  2. Earnings Date End Date : Current Date + 1
  3. Predicted Move (Next Day) Max : 4%
  4. Options Type: Weekly

Strategy Guideline:

  1. Options Strategy: Sell Call and Put
  2. Options Strike Price: Current Stock Price – (% Predicated Move x 2)
  3. Expiration Date: It should generally be the closest expiry immediately after the EA.
  4. Buy Insurance: Buying back Call and Put at Strike price which 10% lower than Sell Strike Price is optional but recommended.

Watch Video for More Detail

Volatility Rush Strategy - Best for Options Traders

The Volatility Rush takes advantage of increasing options premiums into earnings announcements (EA) caused by an anticipated rise in Implied Volatility (IV). With this strategy, Buy a Call and Put at-the-money (a long straddle) 2-3 weeks before the EA when IV is lower. Sell the position either (1) the night before the EA when the company announces earnings pre-market, or (2) during the EA day when it announces post-market, generally capturing IV at or close to its peak.

This popular screen will give you a list of stocks whose Options premiums tend to rise into Earnings. It includes only those stocks whose Earnings are at least two weeks away from today.

Screen criteria:

  1. Earnings Date Start Date : Current Date + 15 Days
  2. Earnings Date End Date : Current Date + 30 Days
  3. Predicted Move (Next Day) Min : 5%
  4. Options Type: Weekly or Monthly if that lines up with the two to three-week lead-time for entering the trade

Strategy Guideline:

  1. Buy a Straddle at or close to the money two to three weeks pre-EA.
  2. Sell the position either the night before the EA when the company announces earnings pre-market, or during the EA day when it announces post-market.
  3. Expiration date should generally be the closest expiry immediately after the EA.
  4. Straddle price should not be more 60% of predicted move.

Predicted Move (Volatility)

Similar to Implied Volatility in Options. Expected volatility % based on our Proprietary Volatility Predication Model. We are expecting that stock price will likely to reach % in either direction by the end of next trading session after Earnings are released and not necessarily the closing volatility %.

Why is it important?

    This indicator helps

  1. Knowing expected volatility in stocks after Earnings helps to decide trading stocks before Earnings Announcement.
  2. Taking Advantage of volatility collapse following Earnings Results by using Advance Options strategies such as Spread and Straddles.

Since Last Earnings

Change in share price since last Earnings release.

Why is it Important?

When share has gained more than 10% since it's last Earning release, it tends to over react to minor bad news and give up some gains if not all. So, it contains more downside volatility than upside When share has dropped more than 10% since it's last Earning release, it tends to over react to minor good news and recover some drops if not all. So, it contains more upside volatility than downside.

EPS Surprise (%)

Occurs when a company's reported quarterly or annual profits are above or below analysts' expectations. Here is the formula to derive % EPS Surprice:

Actual EPS - Estimated EPS
------------------------------------- x 100
Estimated EPS

Why is it Important?

Earnings surprises can have a huge impact on a company's stock price. Several studies suggest that positive earnings surprises not only lead to an immediate hike in a stock's price, but also to a gradual increase over time. Hence, it's not surprising that some companies are known for routinely beating earning projections. A negative earnings surprise will usually result in a decline in share price.

Next Day Price Change (%)

Next Regular trading session Closing price following Earnings result.

For After Market Close Earnings, It is a next trading day closing price. For Before Market Open Earnings, It is the same trading day closing price.

Why is it Important?

Next Day price change is a reaction of Earnings result.

Taiwan Semiconductor (TSM) Has Just Been Caught In The Crossfire

Posted on Jul 16, 2026 by Grayson Cavern

Taiwan Semiconductor (TSM) Has Just Been Caught In The Crossfire

Wall Street’s explanation was simple. Taiwan Semiconductor Manufacturing ADR (NYSE: TSM) beat earnings, then the stock fell, and many headlines hastily pinged it on the management raising capital spending by 15%, and investors concluding that higher spending today meant lower returns tomorrow. I think they’re looking at the wrong problem entirely.

TSM reported EPS of NT$27.25, or US$4.31 per ADR, on NT$1.27 trillion (US$40.2 billion) in second-quarter revenue. Revenue climbed 36% year-over-year, net income surged 77.4%, gross margin expanded to 67.7%, operating margin reached 60.3%, and net profit margin finished at 55.6%. None of these figures suggest that the business is straining under the weight of excessive investment. From my experience, you only get these from a company whose competitive advantage is becoming more expensive to build, and that gap is exactly where most investors are confused right now.

How The Market Scapegoated “CapEx”


Over the past year, investors have watched nearly every major AI company promise unlimited demand, unlimited spending, and unlimited returns on both. Skepticism has followed, reasonably, and so when TSM announced 15% increase in capital expenditure guidance, the market placed it in the same bucket as every other AI infrastructure spending story it has grown tired of trying to underwrite. That reaction is understandable. It’s also the wrong frame for this specific business, because TSM isn’t spending billions hoping customers eventually materialize. Its customers are already here, already committed, and already driving utilization levels that produced a 67.7% gross margin in the same quarter the spending increase was announced.

Look past the headline and the business composition tells you something the selloff obscures. High Performance Computing now generates 66% of total revenue, up from 61% last quarter and 60% a year ago, while smartphone revenue has fallen to 22% as AI infrastructure keeps absorbing a larger share of the wafer mix. The technology breakdown reinforces the same trend; 2nm has already reached 3% of wafer revenue despite only beginning production, 3nm increased to 30%, and 5nm remained a substantial 33%, with advanced nodes collectively representing 77% of total wafer revenue. That’s what additional capital spending is buying, a wider technological lead in the nodes that every serious AI hardware program on earth currently depends on, not more factories

Investors Are Measuring Returns At Exactly The Wrong Moment.

The easiest way to judge capital spending is to look at what it does to free cash flow today. The harder and more important question is what it enables the business to earn three years from now, and conflating those two time horizons is where most of the analytical error in this selloff is concentrated.

TSM deployed US$15.7 billion in capital expenditures during the quarter, bringing year-to-date investment to US$26.8 billion, and free cash flow declined as a direct result because capital expenditures rose faster than operating cash flow in the period. That’s the number that triggered the reaction. But the numbers sitting right beside it deserve equal weight in any honest assessment of what’s actually happening to this balance sheet. Operating cash flow climbed to NT$783.4 billion. Cash and marketable securities increased to NT$3.52 trillion. Net cash reserves reached NT$2.49 trillion. The current ratio held at a healthy 2.5x.

Like aforementioned, TSM isn’t stretching its balance sheet to fund expansion, it’s funding expansion from one of the strongest cash-generating businesses anywhere in the global semiconductor industry, and the margin profile during this investment cycle makes that even more striking. Even overseas fabs, which management acknowledged diluted consolidated margins, couldn’t prevent gross margin from expanding to 67.7%, because utilization remained exceptionally strong and manufacturing efficiency kept improving at the same time.

It’s simple, higher spending, higher margins, and higher profitability in the same quarter is not the financial signature of a company making a reckless bet. But the signature of a business investing from a position of structural strength, and those two setups produce very different outcomes over a three-to-five year horizon.

The Chart And The Conclusion

The post-earnings selloff looks dramatic when you focus on the daily candle. The longer-term structure looks considerably less concerning when you step back and read the full picture. Even after the decline, TSM remains comfortably above its 200-day moving average at $351.08, while price closed at $402.22, below the 20-day average of $438.68 but recovering after testing an intraday low of $397.21… a reversal that suggests buyers stepped in at a level that held rather than gave way.

Daily volume reached 1.24 million shares, reflecting institutional participation rather than the thin, panicked selling that accompanies a genuine thesis break. Price has pulled back toward the rising long-term trendline intact since April, and that’s historically where institutions make the decision between two very different interpretations: a broken business, or a more attractive entry point into an unbroken one.

The market spent the day debating whether US$15.7 billion in quarterly capital spending is too much for investors to absorb. I spent it asking a different question; if AI demand keeps accelerating, if 2nm follows the same adoption curve 3nm has already demonstrated, and if High Performance Computing keeps displacing smartphones as TSMC’s dominant revenue engine, today’s spending levels may look surprisingly conservative three years from now.
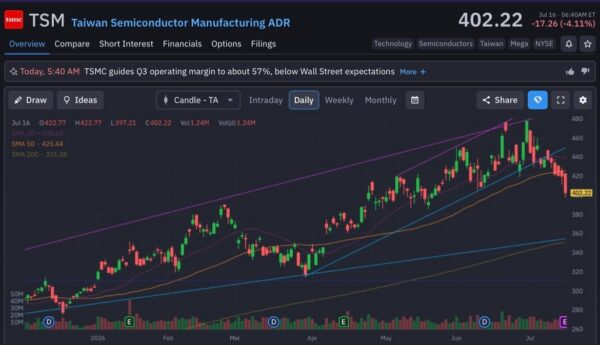
TSM-StockEarnings

That’s why I wouldn’t remember this quarter as the one where TSMC raised CapEx. I’d remember it as the quarter where the market temporarily confused investment with risk. The two can look identical in the short term. Over a full cycle, they’re almost never the same thing.


Join over 1.2M+ investors/traders who receive daily and weekly notable earnings alerts with predicted move