ajax loader

Loading...


Ride-the-Wave Strategy – Best for Stock Traders

Ride-the-Wave targets multi-day price momentum following a company’s earnings announcement (EA). With this strategy:

  1. Buy a stock one day post-EA if a stock reacts positively post-earnings:
    1. Near the close of trading the EA-day for a pre-market-EA
    2. Near the close of the following day for a post-market-EA
  2. Sell-to-close after 7-10 days, or possibly earlier if a desired price target is reached

Similarly,

  1. short a stock one day post-EA if a stock reacts negatively post-earnings:
    1. near the close of trading the EA-day for a premarket-EA
    2. near the close of the following day for a post-market-EA
  2. then buy-to-close after 7-10 days, or possibly earlier if a desired price target is reached

Important: Ride-the-Wave is predicated on significant price momentum triggered by an EA. The 7-10 day scenario is the maximum trade hold-time. If you see post EA-momentum is halted or reversed by a significant opposite move, re-evaluate your presence in the trade.

This popular StockEarnings screen below will give you a list of stocks that historically exhibit significant price momentum following an EA for the next seven days:

  1. Stocks exhibiting positive post-EA price moves are buy-candidates
  2. Stocks exhibiting negative post-EA price moves are sell/short-candidates

The screen includes those stocks whose Earnings just came out in last two days.

Screen criteria:

  1. Earnings Date Start Date : Current Date + -1 Day
  2. Earnings Date End Date : Current Date + -2 Days
  3. Predicted Move (Next Day) Max : 7%
  4. Predicted Move (On 7th Day) Min : 7%

Strategy Guideline:

  1. Buy the stock if stock has reacted positively. Short the stock if stock has reacted negatively (see above).
  2. Close the position in 7-10 days, or possibly earlier based on price move.

Volatility Crush Strategy - Best for Options Traders

The Volatility Crush strategy is used with stocks that typically experience relatively low-to-moderate price moves (≤4%) following their Earnings Announcements (EA). The basic trade idea is to sell put or call options right before the EA, collecting a credit when options premium is very high due to elevated implied volatility (IV). You then close the position right after the EA by buying the option back much cheaper due to the significant drop in IV that occurs after the mystery of the EA disappears. In assessing this trade, you need to do your homework to ensure you collect sufficient premium to make the trade worthwhile.

This trade is practical due to the low-to-moderate price-move after the EA, which generally won’t significantly affect the options price, unlike an “action” stock, which experience great price moves post-EA. With these symbols, if you’re on the right side of the price move, that’s a great thing. But if you’re on the wrong side of the move, not so great. Consequently, by minimizing the effect of the post-EA price move, you have a much better chance to profit from the reduction in IV without it being ruined by a violent price move.

For this trade, open the position either (1) the night before the EA when the company announces earnings or (2) during the EA day when it announces post-market, generally capturing IV at or close to its peak.

For this trade, open the position either (1) the night before the EA when the company announces earnings or (2) during the EA day when it announces post-market, generally capturing IV at or close to its peak.

This popular stockearnings screen will give you a list of stocks which do not react more than 4% fpost-EA. It includes only those stocks whose earnings are releasing next day.

Screen criteria:

  1. Earnings Date Start Date : Current Date + 1
  2. Earnings Date End Date : Current Date + 1
  3. Predicted Move (Next Day) Max : 4%
  4. Options Type: Weekly

Strategy Guideline:

  1. Options Strategy: Sell Call and Put
  2. Options Strike Price: Current Stock Price – (% Predicated Move x 2)
  3. Expiration Date: It should generally be the closest expiry immediately after the EA.
  4. Buy Insurance: Buying back Call and Put at Strike price which 10% lower than Sell Strike Price is optional but recommended.

Watch Video for More Detail

Volatility Rush Strategy - Best for Options Traders

The Volatility Rush takes advantage of increasing options premiums into earnings announcements (EA) caused by an anticipated rise in Implied Volatility (IV). With this strategy, Buy a Call and Put at-the-money (a long straddle) 2-3 weeks before the EA when IV is lower. Sell the position either (1) the night before the EA when the company announces earnings pre-market, or (2) during the EA day when it announces post-market, generally capturing IV at or close to its peak.

This popular screen will give you a list of stocks whose Options premiums tend to rise into Earnings. It includes only those stocks whose Earnings are at least two weeks away from today.

Screen criteria:

  1. Earnings Date Start Date : Current Date + 15 Days
  2. Earnings Date End Date : Current Date + 30 Days
  3. Predicted Move (Next Day) Min : 5%
  4. Options Type: Weekly or Monthly if that lines up with the two to three-week lead-time for entering the trade

Strategy Guideline:

  1. Buy a Straddle at or close to the money two to three weeks pre-EA.
  2. Sell the position either the night before the EA when the company announces earnings pre-market, or during the EA day when it announces post-market.
  3. Expiration date should generally be the closest expiry immediately after the EA.
  4. Straddle price should not be more 60% of predicted move.

Predicted Move (Volatility)

Similar to Implied Volatility in Options. Expected volatility % based on our Proprietary Volatility Predication Model. We are expecting that stock price will likely to reach % in either direction by the end of next trading session after Earnings are released and not necessarily the closing volatility %.

Why is it important?

    This indicator helps

  1. Knowing expected volatility in stocks after Earnings helps to decide trading stocks before Earnings Announcement.
  2. Taking Advantage of volatility collapse following Earnings Results by using Advance Options strategies such as Spread and Straddles.

Since Last Earnings

Change in share price since last Earnings release.

Why is it Important?

When share has gained more than 10% since it's last Earning release, it tends to over react to minor bad news and give up some gains if not all. So, it contains more downside volatility than upside When share has dropped more than 10% since it's last Earning release, it tends to over react to minor good news and recover some drops if not all. So, it contains more upside volatility than downside.

EPS Surprise (%)

Occurs when a company's reported quarterly or annual profits are above or below analysts' expectations. Here is the formula to derive % EPS Surprice:

Actual EPS - Estimated EPS
------------------------------------- x 100
Estimated EPS

Why is it Important?

Earnings surprises can have a huge impact on a company's stock price. Several studies suggest that positive earnings surprises not only lead to an immediate hike in a stock's price, but also to a gradual increase over time. Hence, it's not surprising that some companies are known for routinely beating earning projections. A negative earnings surprise will usually result in a decline in share price.

Next Day Price Change (%)

Next Regular trading session Closing price following Earnings result.

For After Market Close Earnings, It is a next trading day closing price. For Before Market Open Earnings, It is the same trading day closing price.

Why is it Important?

Next Day price change is a reaction of Earnings result.

How Investors Punished GE Aerospace For Not Being A Perfect Company

Posted on Jul 16, 2026 by Grayson Cavern

How Investors Punished GE Aerospace For Not Being A Perfect Company

There wasn’t much to complain about in GE Aerospace’s (NYSE: GE) second-quarter earnings. Adjusted EPS came in at $2.02, comfortably ahead of Wall Street’s $1.86 estimate, while revenue climbed 24% to $12.63 billion and also beat expectations. Management then raised full-year guidance across revenue, earnings, operating profit, and free cash flow simultaneously… the kind of broad-based upgrade that typically produces a positive stock reaction.

And yes, the stock fell anyway. But while the obvious conclusion is that investors found something they didn’t like inside the report, I discovered that GE Aerospace didn’t really disappoint investors, it just didn’t exceed the expectations they had already priced into the stock before the report ever landed, and the distance between those two interpretations changes everything about how you should be thinking about this quarter.

The Numbers Left Almost No Room For Debate


Every meaningful operating metric moved in the right direction, and the magnitude of the moves wasn’t incremental. Orders increased 17% to $16.5 billion, pushing total backlog above $210 billion, a figure that represents years of contracted revenue sitting in reserve. Revenue climbed 24%, adjusted operating profit grew 18% to $2.7 billion, adjusted EPS increased 22%, and free cash flow surged 43% to $3.0 billion in a single quarter.

The commercial business carried the heaviest load. Commercial Engines and Services revenue jumped 27%, supported by 26% growth in services and 30% growth in equipment, with LEAP engine deliveries up 24%, internal shop visit revenue climbing 25%, and spare-parts demand remaining exceptionally strong as airlines kept flying older fleets harder for longer rather than accelerating new aircraft orders. Defense contributed in parallel, with revenue growing 16%, operating profit up 18%, and first-half defense book-to-bill reaching 1.7x, a ratio that tells you demand is running well ahead of what current production can absorb.

Then came guidance, and this is where the quarter becomes genuinely difficult to dismiss. Adjusted EPS moved from $7.10 – $7.40 to $7.65 – $7.85. Operating profit guidance increased from $9.85 – $10.25 billion to $10.55 – $10.75 billion. Free cash flow guidance rose from $8.0 – $8.4 billion to $8.9 – $9.2 billion. Revenue growth guidance moved from low double digits to high-teens growth. Management doesn’t raise guidance that broadly across every major metric unless they’re seeing more business than they expected when they set the original targets just a few months earlier. Sadly, that’s the version of this company the stock reaction failed to price.

The Market Wanted A Perfect Company 

Now this is where the post-earnings selloff starts to make sense without requiring any fundamental deterioration in the business to explain it. By the time GE Aerospace reported, the stock had already done extraordinary work, shares had climbed from roughly $280 in April to almost $380 before the report, a gain of more than 35% in just a few months, compressing into earnings on the assumption that the results would validate every dollar of that move and then some.

When expectations rise that quickly, another excellent quarter becomes the minimum requirement rather than the catalyst. The bar shifts from “beat” to “transform the narrative,” and almost no business can clear that bar consistently at the pace the stock had been implying. What investors received was a quarter that confirmed the bull thesis in every measurable way. The only crime was it wasn’t dramatic enough to justify buying at a price that had already priced in something exceptional.

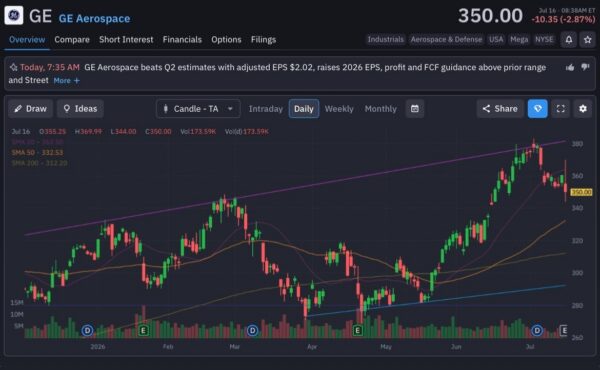
You’ll see this with unusual clarity inside its chart. Before the earnings release, GE Aerospace rejected almost perfectly from the upper boundary of its long-term ascending trendline near $380. Following the report, shares closed at $350.00 after trading between $344.00 and $369.99, while volume increased to roughly 173,600 shares. That’s a real profit-taking from investors who had held through a powerful rally and used a strong print as the exit rather than the entry. Even after that decline, the broader structure remains intact, with the stock continuing to trade above the 50-day moving average at $332.53 and the 200-day at $312.20. The 20-day at $363.50 becomes the first level worth watching as the stock attempts to rebuild momentum.

As I’ve explained, nothing in that chart suggests institutions have abandoned the long-term thesis. It looks far more like a market exhaling after an extended run than a market reassessing whether the business deserves the premium it commands.
ge aerospace-StockEarnings

What This Quarter Actually Changed

The selloff will get read as a warning by investors who treat every post-earnings decline as a signal that something has quietly gone wrong. I don’t see it that way, and the numbers make it difficult to construct a credible case that anything actually deteriorated. GE Aerospace didn’t report slowing demand, didn’t cut guidance, didn’t lose share in commercial engines or defense, and didn’t expose any weakness in the franchise that the prior quarter’s optimism had glossed over. It produced stronger orders, stronger earnings, stronger cash flow, and higher guidance while maintaining one of the largest industrial backlogs in the sector.

The bar had simply moved higher than a single quarter could realistically clear, and expectations outran execution in a way that has nothing to do with whether the underlying investment case remains intact. If GE Aerospace keeps converting its $210 billion backlog into higher-margin services revenue, continues expanding LEAP deliveries, and keeps raising guidance the way it did this quarter, the selloff following these results may eventually look less like the beginning of a reversal and more like the pause that exceptional businesses often need after exceptional rallies, before the next leg begins.


Join over 1.2M+ investors/traders who receive daily and weekly notable earnings alerts with predicted move