ajax loader

Loading...


Ride-the-Wave Strategy – Best for Stock Traders

Ride-the-Wave targets multi-day price momentum following a company’s earnings announcement (EA). With this strategy:

  1. Buy a stock one day post-EA if a stock reacts positively post-earnings:
    1. Near the close of trading the EA-day for a pre-market-EA
    2. Near the close of the following day for a post-market-EA
  2. Sell-to-close after 7-10 days, or possibly earlier if a desired price target is reached

Similarly,

  1. short a stock one day post-EA if a stock reacts negatively post-earnings:
    1. near the close of trading the EA-day for a premarket-EA
    2. near the close of the following day for a post-market-EA
  2. then buy-to-close after 7-10 days, or possibly earlier if a desired price target is reached

Important: Ride-the-Wave is predicated on significant price momentum triggered by an EA. The 7-10 day scenario is the maximum trade hold-time. If you see post EA-momentum is halted or reversed by a significant opposite move, re-evaluate your presence in the trade.

This popular StockEarnings screen below will give you a list of stocks that historically exhibit significant price momentum following an EA for the next seven days:

  1. Stocks exhibiting positive post-EA price moves are buy-candidates
  2. Stocks exhibiting negative post-EA price moves are sell/short-candidates

The screen includes those stocks whose Earnings just came out in last two days.

Screen criteria:

  1. Earnings Date Start Date : Current Date + -1 Day
  2. Earnings Date End Date : Current Date + -2 Days
  3. Predicted Move (Next Day) Max : 7%
  4. Predicted Move (On 7th Day) Min : 7%

Strategy Guideline:

  1. Buy the stock if stock has reacted positively. Short the stock if stock has reacted negatively (see above).
  2. Close the position in 7-10 days, or possibly earlier based on price move.

Volatility Crush Strategy - Best for Options Traders

The Volatility Crush strategy is used with stocks that typically experience relatively low-to-moderate price moves (≤4%) following their Earnings Announcements (EA). The basic trade idea is to sell put or call options right before the EA, collecting a credit when options premium is very high due to elevated implied volatility (IV). You then close the position right after the EA by buying the option back much cheaper due to the significant drop in IV that occurs after the mystery of the EA disappears. In assessing this trade, you need to do your homework to ensure you collect sufficient premium to make the trade worthwhile.

This trade is practical due to the low-to-moderate price-move after the EA, which generally won’t significantly affect the options price, unlike an “action” stock, which experience great price moves post-EA. With these symbols, if you’re on the right side of the price move, that’s a great thing. But if you’re on the wrong side of the move, not so great. Consequently, by minimizing the effect of the post-EA price move, you have a much better chance to profit from the reduction in IV without it being ruined by a violent price move.

For this trade, open the position either (1) the night before the EA when the company announces earnings or (2) during the EA day when it announces post-market, generally capturing IV at or close to its peak.

For this trade, open the position either (1) the night before the EA when the company announces earnings or (2) during the EA day when it announces post-market, generally capturing IV at or close to its peak.

This popular stockearnings screen will give you a list of stocks which do not react more than 4% fpost-EA. It includes only those stocks whose earnings are releasing next day.

Screen criteria:

  1. Earnings Date Start Date : Current Date + 1
  2. Earnings Date End Date : Current Date + 1
  3. Predicted Move (Next Day) Max : 4%
  4. Options Type: Weekly

Strategy Guideline:

  1. Options Strategy: Sell Call and Put
  2. Options Strike Price: Current Stock Price – (% Predicated Move x 2)
  3. Expiration Date: It should generally be the closest expiry immediately after the EA.
  4. Buy Insurance: Buying back Call and Put at Strike price which 10% lower than Sell Strike Price is optional but recommended.

Watch Video for More Detail

Volatility Rush Strategy - Best for Options Traders

The Volatility Rush takes advantage of increasing options premiums into earnings announcements (EA) caused by an anticipated rise in Implied Volatility (IV). With this strategy, Buy a Call and Put at-the-money (a long straddle) 2-3 weeks before the EA when IV is lower. Sell the position either (1) the night before the EA when the company announces earnings pre-market, or (2) during the EA day when it announces post-market, generally capturing IV at or close to its peak.

This popular screen will give you a list of stocks whose Options premiums tend to rise into Earnings. It includes only those stocks whose Earnings are at least two weeks away from today.

Screen criteria:

  1. Earnings Date Start Date : Current Date + 15 Days
  2. Earnings Date End Date : Current Date + 30 Days
  3. Predicted Move (Next Day) Min : 5%
  4. Options Type: Weekly or Monthly if that lines up with the two to three-week lead-time for entering the trade

Strategy Guideline:

  1. Buy a Straddle at or close to the money two to three weeks pre-EA.
  2. Sell the position either the night before the EA when the company announces earnings pre-market, or during the EA day when it announces post-market.
  3. Expiration date should generally be the closest expiry immediately after the EA.
  4. Straddle price should not be more 60% of predicted move.

Predicted Move (Volatility)

Similar to Implied Volatility in Options. Expected volatility % based on our Proprietary Volatility Predication Model. We are expecting that stock price will likely to reach % in either direction by the end of next trading session after Earnings are released and not necessarily the closing volatility %.

Why is it important?

    This indicator helps

  1. Knowing expected volatility in stocks after Earnings helps to decide trading stocks before Earnings Announcement.
  2. Taking Advantage of volatility collapse following Earnings Results by using Advance Options strategies such as Spread and Straddles.

Since Last Earnings

Change in share price since last Earnings release.

Why is it Important?

When share has gained more than 10% since it's last Earning release, it tends to over react to minor bad news and give up some gains if not all. So, it contains more downside volatility than upside When share has dropped more than 10% since it's last Earning release, it tends to over react to minor good news and recover some drops if not all. So, it contains more upside volatility than downside.

EPS Surprise (%)

Occurs when a company's reported quarterly or annual profits are above or below analysts' expectations. Here is the formula to derive % EPS Surprice:

Actual EPS - Estimated EPS
------------------------------------- x 100
Estimated EPS

Why is it Important?

Earnings surprises can have a huge impact on a company's stock price. Several studies suggest that positive earnings surprises not only lead to an immediate hike in a stock's price, but also to a gradual increase over time. Hence, it's not surprising that some companies are known for routinely beating earning projections. A negative earnings surprise will usually result in a decline in share price.

Next Day Price Change (%)

Next Regular trading session Closing price following Earnings result.

For After Market Close Earnings, It is a next trading day closing price. For Before Market Open Earnings, It is the same trading day closing price.

Why is it Important?

Next Day price change is a reaction of Earnings result.

There Still Might Be a Chance to Scalp Profits from Oracle Stock

Posted on Aug 12, 2026 by Joshua Enomoto

There Still Might Be a Chance to Scalp Profits from Oracle Stock

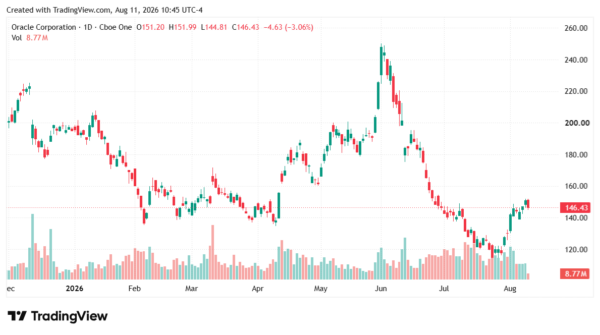
Despite wobbly circumstances in the broader economy, Oracle (NYSE: ORCL) has managed to string together an impressive performance. Sure, the overwhelming picture is of ORCL stock losing 22.5% on a year-to-date basis. Yes, it’s ugly, warranting fundamental concerns about the sustainability of artificial intelligence. At the same time, we must also acknowledge the ticker gaining nearly 15% in the trailing month.
oracle-StockEarnings

Now, the obvious question: is the swing higher in ORCL stock a fluke or can we anticipate further gains?

It’s here that routine financial publications will wax poetic about Oracle’s fundamentals to make their case, either bullish or bearish. While I’m not opposed to the idea of presenting context for ORCL stock, I have a suspicion that doing so is a redundancy. Let’s face it, ORCL is a popular security so you’ve probably already read up on the latest news.

Plus, the more important point is that whatever material public information that has been disclosed has likely been baked into the Oracle stock price. Yes, it might be the case that an independent contractor has found an insight that all the big institutions have missed. But I believe such circumstances are rare.

Next, someone may point to technical analysis to determine where ORCL stock may end up at some point in the future. Basically, the idea is that the past may give clues about what may happen tomorrow. In principle, I agree with this inductive approach. However, technical analysis as it is commonly practiced tends to be undisciplined.

Usually, a practitioner sees some sign or pattern and presumes a probabilistic forward response. But the main problem that I see is that the sign/pattern in question is unconditioned. Just because an analyst sees something in isolation doesn’t necessarily indicate — or even infer — that the target stock will move unusually compared to the random baseline.

ORCL Stock Still ‘Suffers’ From an Order Flow Imbalance


While we may have differences regarding the effectiveness of fundamental and technical analysis, I think we can all agree that equity market behaviors rarely occur in a vacuum (if ever). Advanced research has indicated that markets are reflexive — you can’t determine where Oracle stock may go next with absolute precision because participants respond to shifting circumstances.

It’s like the handicappers at Las Vegas. I’ve said this before but if two evenly matched football teams are scheduled to clash, the odds regarding who may win may be 50/50. But if one of the team’s starting quarterback goes down with an injury prior to kickoff, guess what? Suddenly, the odds may tilt to 65/35 or some other bias beyond 50/50.

No serious sports fan is going to question that dynamic. So, my hypothesis is, why would a serious market participant question an analogous situation for equities?

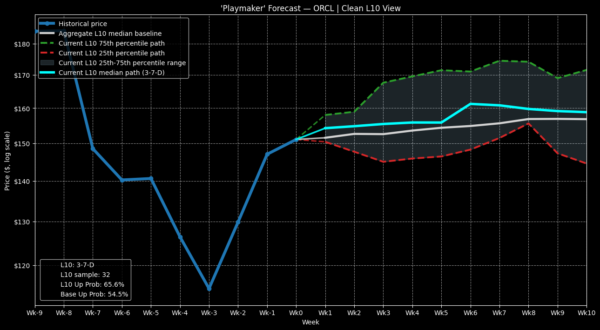
In some ways, you might say (metaphorically speaking) that ORCL stock has lost its starting QB to injury. In the last 10-week period, Oracle has only managed to print three weekly net positive candlesticks, thereby leading to a downward slope. This 3-7-D quantitative sequence is clearly bearish from an order flow balance perspective: there are simply more negative sessions than positive ones within an arbitrarily defined time period.
oracle-StockEarnings

Okay, so what do we do with this information? We simply filter for past market data where Oracle stock flashed this exact quant sequence. We then observe what has happened in the next 10-week period following the flashing of this signal. Finally, we gather this data and discover what the median endpoint outcome is for each week of the forecasted period.

If you want to get into the nitty-gritty, you may read this StockEarnings article I wrote last week about ORCL stock. On Aug. 5, I stated that, based on that week’s 2-8-D signal, an intriguing idea is to consider the 145/150 bull call spread expiring Aug. 28. Back then, the share price was $144.39 at close. I can’t guarantee anything but on Monday, Aug. 10, the share price was $151.05.

What’s Next for Oracle Stock?

I’ve been talking extensively about ORCL stock so there’s a risk of overdoing the narrative. In mid-July, I stated that the 135/140 bull call spread expiring Aug. 21 was a good idea, especially because I calculated that the Black-Scholes-assigned probability of profit of 41.8% was likely too pessimistic.

Again, if you look through the technical charts as of the date of this writing (Aug. 10), you can see that I was justified in presenting my alternative probability of profit of 59.4%. I’m not saying that this inductive model is foolproof but under certain circumstances, it may provide a more realistic picture than whatever Wall Street is feeding you.

Given that Oracle stock is currently structured in a 3-7-D sequence, using basic statistics, the median endpoint price at the end of week 6 has been observed to be the equivalent of $160. Assuming that the above model is an accurate representation of future probabilities, there is a mathematical incentive to consider the Sep. 18 155/160 bull call spread.

This idea involves paying a net debit of $230 for the chance to generate a max profit of $270. Again, if the inductive model is accurate, over the theoretical long run, this call spread would likely enjoy positive expected value (EV). It comes down to basic math.
oracle-StockEarnings

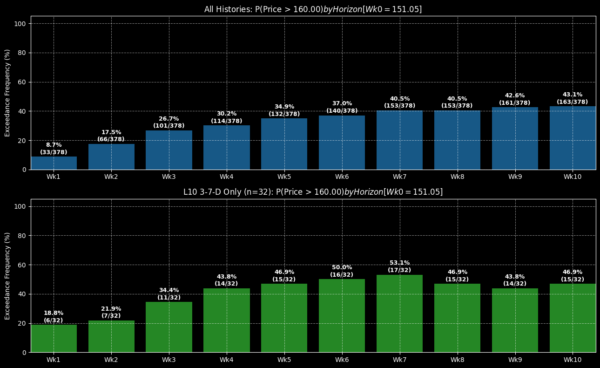
Of the 32 times that the 3-7-D signal has flashed on a rolling basis since January 2019, Oracle stock has risen above the equivalent of the $160 strike a total of 16 times at the end of week 6 (Sep. 18). From this framework, we would anticipate that the ORCL call spread will pay out $135 (0.50 x $270), while losing $115 (0.50 x $230).

If you play this exact same trade multiple times, you would expect a net gain of $20. That’s positive EV for you.

A Caveat Before You Trade


I have to be crystal clear because nuance tends to be lost in the internet. I am not God. I do not know the future. Merely, I am building an inductive case about what might happen tomorrow based on how prior trends fixed to a specific quant sequence have materialized.

But please note this: while the aforementioned signal may imply above-average behavior, this positive result is not logically necessary. My model is not at all presented as a static law of market performance. At any time, the overall sentiment regime can shift, either locally or broadly. If it does, all bets may be off the table.

So yes, I am making a presupposition and it’s up to you to decide whether you accept the premise or not. But also realize this: Wall Street (through Black-Scholes) is also making a presupposition. Therefore, only the trader can decide which presupposition they find more credible.

I presented my case; and now it’s up to you to choose.

Joshua Enomoto is a seasoned financial writer with a strong track record of in-depth stock analysis, offering clear, insightful commentary for retail investors across all levels of expertise. Renowned for his ability to blend analytical rigor with engaging wit, Joshua's work has been featured on leading investment platforms, including TipRanks, InvestorPlace, Barchart, Benzinga, and Fintel. He was also handpicked to spearhead high-impact initiatives such as InvestorPlace's "Trade of the Day" and Benzinga’s ETF coverage. As a frequent guest expert for CGTN America, Joshua discusses a wide range of economic, societal, and consumer market trends. A graduate of U.C. San Diego, Joshua brings a thoughtful and fresh perspective to complex financial narratives, helping enterprise clients connect with their audiences. He also composes music in his spare time.

Join over 1.2M+ investors/traders who receive daily and weekly notable earnings alerts with predicted move
