ajax loader

Loading...


Ride-the-Wave Strategy – Best for Stock Traders

Ride-the-Wave targets multi-day price momentum following a company’s earnings announcement (EA). With this strategy:

  1. Buy a stock one day post-EA if a stock reacts positively post-earnings:
    1. Near the close of trading the EA-day for a pre-market-EA
    2. Near the close of the following day for a post-market-EA
  2. Sell-to-close after 7-10 days, or possibly earlier if a desired price target is reached

Similarly,

  1. short a stock one day post-EA if a stock reacts negatively post-earnings:
    1. near the close of trading the EA-day for a premarket-EA
    2. near the close of the following day for a post-market-EA
  2. then buy-to-close after 7-10 days, or possibly earlier if a desired price target is reached

Important: Ride-the-Wave is predicated on significant price momentum triggered by an EA. The 7-10 day scenario is the maximum trade hold-time. If you see post EA-momentum is halted or reversed by a significant opposite move, re-evaluate your presence in the trade.

This popular StockEarnings screen below will give you a list of stocks that historically exhibit significant price momentum following an EA for the next seven days:

  1. Stocks exhibiting positive post-EA price moves are buy-candidates
  2. Stocks exhibiting negative post-EA price moves are sell/short-candidates

The screen includes those stocks whose Earnings just came out in last two days.

Screen criteria:

  1. Earnings Date Start Date : Current Date + -1 Day
  2. Earnings Date End Date : Current Date + -2 Days
  3. Predicted Move (Next Day) Max : 7%
  4. Predicted Move (On 7th Day) Min : 7%

Strategy Guideline:

  1. Buy the stock if stock has reacted positively. Short the stock if stock has reacted negatively (see above).
  2. Close the position in 7-10 days, or possibly earlier based on price move.

Volatility Crush Strategy - Best for Options Traders

The Volatility Crush strategy is used with stocks that typically experience relatively low-to-moderate price moves (≤4%) following their Earnings Announcements (EA). The basic trade idea is to sell put or call options right before the EA, collecting a credit when options premium is very high due to elevated implied volatility (IV). You then close the position right after the EA by buying the option back much cheaper due to the significant drop in IV that occurs after the mystery of the EA disappears. In assessing this trade, you need to do your homework to ensure you collect sufficient premium to make the trade worthwhile.

This trade is practical due to the low-to-moderate price-move after the EA, which generally won’t significantly affect the options price, unlike an “action” stock, which experience great price moves post-EA. With these symbols, if you’re on the right side of the price move, that’s a great thing. But if you’re on the wrong side of the move, not so great. Consequently, by minimizing the effect of the post-EA price move, you have a much better chance to profit from the reduction in IV without it being ruined by a violent price move.

For this trade, open the position either (1) the night before the EA when the company announces earnings or (2) during the EA day when it announces post-market, generally capturing IV at or close to its peak.

For this trade, open the position either (1) the night before the EA when the company announces earnings or (2) during the EA day when it announces post-market, generally capturing IV at or close to its peak.

This popular stockearnings screen will give you a list of stocks which do not react more than 4% fpost-EA. It includes only those stocks whose earnings are releasing next day.

Screen criteria:

  1. Earnings Date Start Date : Current Date + 1
  2. Earnings Date End Date : Current Date + 1
  3. Predicted Move (Next Day) Max : 4%
  4. Options Type: Weekly

Strategy Guideline:

  1. Options Strategy: Sell Call and Put
  2. Options Strike Price: Current Stock Price – (% Predicated Move x 2)
  3. Expiration Date: It should generally be the closest expiry immediately after the EA.
  4. Buy Insurance: Buying back Call and Put at Strike price which 10% lower than Sell Strike Price is optional but recommended.

Watch Video for More Detail

Volatility Rush Strategy - Best for Options Traders

The Volatility Rush takes advantage of increasing options premiums into earnings announcements (EA) caused by an anticipated rise in Implied Volatility (IV). With this strategy, Buy a Call and Put at-the-money (a long straddle) 2-3 weeks before the EA when IV is lower. Sell the position either (1) the night before the EA when the company announces earnings pre-market, or (2) during the EA day when it announces post-market, generally capturing IV at or close to its peak.

This popular screen will give you a list of stocks whose Options premiums tend to rise into Earnings. It includes only those stocks whose Earnings are at least two weeks away from today.

Screen criteria:

  1. Earnings Date Start Date : Current Date + 15 Days
  2. Earnings Date End Date : Current Date + 30 Days
  3. Predicted Move (Next Day) Min : 5%
  4. Options Type: Weekly or Monthly if that lines up with the two to three-week lead-time for entering the trade

Strategy Guideline:

  1. Buy a Straddle at or close to the money two to three weeks pre-EA.
  2. Sell the position either the night before the EA when the company announces earnings pre-market, or during the EA day when it announces post-market.
  3. Expiration date should generally be the closest expiry immediately after the EA.
  4. Straddle price should not be more 60% of predicted move.

Predicted Move (Volatility)

Similar to Implied Volatility in Options. Expected volatility % based on our Proprietary Volatility Predication Model. We are expecting that stock price will likely to reach % in either direction by the end of next trading session after Earnings are released and not necessarily the closing volatility %.

Why is it important?

    This indicator helps

  1. Knowing expected volatility in stocks after Earnings helps to decide trading stocks before Earnings Announcement.
  2. Taking Advantage of volatility collapse following Earnings Results by using Advance Options strategies such as Spread and Straddles.

Since Last Earnings

Change in share price since last Earnings release.

Why is it Important?

When share has gained more than 10% since it's last Earning release, it tends to over react to minor bad news and give up some gains if not all. So, it contains more downside volatility than upside When share has dropped more than 10% since it's last Earning release, it tends to over react to minor good news and recover some drops if not all. So, it contains more upside volatility than downside.

EPS Surprise (%)

Occurs when a company's reported quarterly or annual profits are above or below analysts' expectations. Here is the formula to derive % EPS Surprice:

Actual EPS - Estimated EPS
------------------------------------- x 100
Estimated EPS

Why is it Important?

Earnings surprises can have a huge impact on a company's stock price. Several studies suggest that positive earnings surprises not only lead to an immediate hike in a stock's price, but also to a gradual increase over time. Hence, it's not surprising that some companies are known for routinely beating earning projections. A negative earnings surprise will usually result in a decline in share price.

Next Day Price Change (%)

Next Regular trading session Closing price following Earnings result.

For After Market Close Earnings, It is a next trading day closing price. For Before Market Open Earnings, It is the same trading day closing price.

Why is it Important?

Next Day price change is a reaction of Earnings result.

Shipping Stocks Are Flashing A Signal Wall Street Can’t Ignore

Posted on Jul 03, 2026 by Grayson Cavern

Shipping Stocks Are Flashing A Signal Wall Street Can’t Ignore

Most investors don’t spend their mornings watching freight rates or dry bulk carriers. They watch the S&P 500, Treasury yields and whatever Nvidia happens to be doing that day. Ironically, one of the earliest clues about where those markets could be headed is often floating somewhere between Australia and China carrying iron ore.

That’s why shipping stocks have always fascinated me.

They rarely lead financial headlines, yet they sit at the very beginning of the economic chain. Before factories increase production, before retailers restock shelves, before stronger earnings begin appearing in quarterly reports, someone has to move the raw materials that make all of it possible. If those ships slow down, the effects eventually ripple through manufacturers, retailers and, ultimately, stock portfolios.

Lately, shipping has started telling a story I don’t think Wall Street can afford to ignore.

Global Trade May Be Finding Its Footing


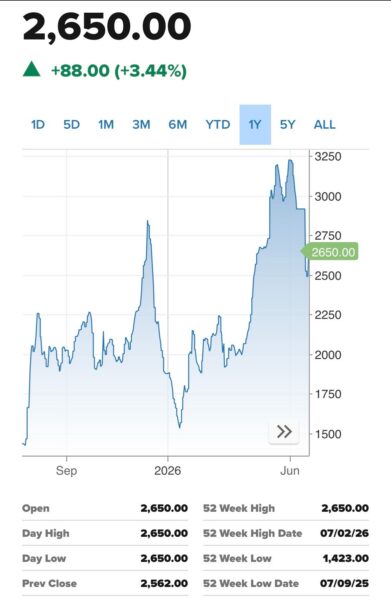
The Baltic Dry Index, one of the world’s most closely watched measures of shipping costs for raw materials, has spent the past several weeks sending mixed signals. After falling sharply from above 3,200 points to below 2,500, the index has now climbed back to 2,650, marking its third consecutive advance and its highest reading since June 24.

Rates for Capesize vessels, the massive ships carrying roughly 150,000 tons of iron ore and coal, climbed 6.2% to 3,291, supported by improving cargo activity along Australia’s and Brazil’s major export routes. Panamax rates rose 0.8%, while Supramax vessels also edged higher, suggesting the recovery isn’t confined to a single corner of global shipping.

None of this guarantees the global economy is suddenly accelerating again. It does suggest that the demand for the raw materials economies consume before factories manufacture finished goods hasn’t continued deteriorating the way many investors feared just a few weeks ago. That’s an important distinction because shipping doesn’t wait for GDP reports or corporate earnings to confirm what’s already happened. It responds to purchase orders being placed today for production that may not show up in financial statements until months from now.

Why Shipping Stocks Matter Beyond Shipping

This is where I think investors often misunderstand the industry. Shipping companies aren’t simply transporting cargo. They’re transporting information.

Every container filled with machinery, every shipment of iron ore, every cargo of coal or grain represents a business somewhere making a decision about future demand. Manufacturers don’t order raw materials because last quarter’s earnings looked good. They order them because they expect future production to justify today’s purchases.

That’s why shipping has earned a reputation as one of the economy’s earliest indicators.

When shipping volumes weaken, it often reflects businesses becoming more cautious long before consumers notice any difference. When freight demand begins stabilizing after a sharp decline, it can signal companies are regaining enough confidence to replenish inventories, restart projects or prepare for stronger activity ahead.

The message isn’t always perfect. But it usually arrives earlier than the headlines everyone else is watching.

The Market Is Watching The Same Tug Of War

The recent movement in shipping reflects the same uncertainty dominating financial markets.

Tariffs continue reshaping trade routes. Companies are still diversifying supply chains after years of geopolitical disruptions. Manufacturers remain cautious about committing capital while waiting for greater clarity on global demand.

That uncertainty explains why the Baltic Dry Index hasn’t recovered in a straight line. The one-year chart tells a far more interesting story than a simple rebound. After climbing from roughly 1,400 to above 3,200, freight rates surrendered much of those gains before finding buyers again near 2,500. The latest recovery toward 2,650 suggests investors haven’t abandoned the shipping story. They’re testing whether recent weakness represented a temporary pause or the beginning of something more persistent.

Markets behave the same way. They don’t price certainty. They constantly weigh competing probabilities. Shipping stocks are doing exactly that today.

shipping stocks-StockEarnings

What I’m Watching Next

Following this under-the-radar sector is dear to me because they often force me to think about the economy several months before quarterly earnings begin telling the same story.

If this recovery in shipping continues broadening across vessel classes while freight rates keep stabilizing, I’d become increasingly interested in what that implies for industrial companies, commodity producers, railroads and manufacturers whose fortunes depend on healthy trade flows. If, instead, this proves to be another short-lived bounce before freight demand resumes weakening, I’d treat it as an early reminder that optimism about global growth may have gotten ahead of itself.

Either outcome reaches much further than shipping.

By the time stronger trade appears in corporate earnings, the ships carrying the iron ore, coal and grain behind those numbers have usually completed their voyages long ago. I don’t believe shipping stocks are the next big winners. But I’ll keep watching companies like A.P. Moller – Maersk (CPH: MAERSK-B), ZIM Integrated Shipping Services (NYSE: ZIM) and Star Bulk Carriers (NASDAQ: SBLK), because they often provide one of the earliest windows into where global trade, and eventually corporate earnings, are heading.

Join over 1.2M+ investors/traders who receive daily and weekly notable earnings alerts with predicted move