ajax loader

Loading...


Ride-the-Wave Strategy – Best for Stock Traders

Ride-the-Wave targets multi-day price momentum following a company’s earnings announcement (EA). With this strategy:

  1. Buy a stock one day post-EA if a stock reacts positively post-earnings:
    1. Near the close of trading the EA-day for a pre-market-EA
    2. Near the close of the following day for a post-market-EA
  2. Sell-to-close after 7-10 days, or possibly earlier if a desired price target is reached

Similarly,

  1. short a stock one day post-EA if a stock reacts negatively post-earnings:
    1. near the close of trading the EA-day for a premarket-EA
    2. near the close of the following day for a post-market-EA
  2. then buy-to-close after 7-10 days, or possibly earlier if a desired price target is reached

Important: Ride-the-Wave is predicated on significant price momentum triggered by an EA. The 7-10 day scenario is the maximum trade hold-time. If you see post EA-momentum is halted or reversed by a significant opposite move, re-evaluate your presence in the trade.

This popular StockEarnings screen below will give you a list of stocks that historically exhibit significant price momentum following an EA for the next seven days:

  1. Stocks exhibiting positive post-EA price moves are buy-candidates
  2. Stocks exhibiting negative post-EA price moves are sell/short-candidates

The screen includes those stocks whose Earnings just came out in last two days.

Screen criteria:

  1. Earnings Date Start Date : Current Date + -1 Day
  2. Earnings Date End Date : Current Date + -2 Days
  3. Predicted Move (Next Day) Max : 7%
  4. Predicted Move (On 7th Day) Min : 7%

Strategy Guideline:

  1. Buy the stock if stock has reacted positively. Short the stock if stock has reacted negatively (see above).
  2. Close the position in 7-10 days, or possibly earlier based on price move.

Volatility Crush Strategy - Best for Options Traders

The Volatility Crush strategy is used with stocks that typically experience relatively low-to-moderate price moves (≤4%) following their Earnings Announcements (EA). The basic trade idea is to sell put or call options right before the EA, collecting a credit when options premium is very high due to elevated implied volatility (IV). You then close the position right after the EA by buying the option back much cheaper due to the significant drop in IV that occurs after the mystery of the EA disappears. In assessing this trade, you need to do your homework to ensure you collect sufficient premium to make the trade worthwhile.

This trade is practical due to the low-to-moderate price-move after the EA, which generally won’t significantly affect the options price, unlike an “action” stock, which experience great price moves post-EA. With these symbols, if you’re on the right side of the price move, that’s a great thing. But if you’re on the wrong side of the move, not so great. Consequently, by minimizing the effect of the post-EA price move, you have a much better chance to profit from the reduction in IV without it being ruined by a violent price move.

For this trade, open the position either (1) the night before the EA when the company announces earnings or (2) during the EA day when it announces post-market, generally capturing IV at or close to its peak.

For this trade, open the position either (1) the night before the EA when the company announces earnings or (2) during the EA day when it announces post-market, generally capturing IV at or close to its peak.

This popular stockearnings screen will give you a list of stocks which do not react more than 4% fpost-EA. It includes only those stocks whose earnings are releasing next day.

Screen criteria:

  1. Earnings Date Start Date : Current Date + 1
  2. Earnings Date End Date : Current Date + 1
  3. Predicted Move (Next Day) Max : 4%
  4. Options Type: Weekly

Strategy Guideline:

  1. Options Strategy: Sell Call and Put
  2. Options Strike Price: Current Stock Price – (% Predicated Move x 2)
  3. Expiration Date: It should generally be the closest expiry immediately after the EA.
  4. Buy Insurance: Buying back Call and Put at Strike price which 10% lower than Sell Strike Price is optional but recommended.

Watch Video for More Detail

Volatility Rush Strategy - Best for Options Traders

The Volatility Rush takes advantage of increasing options premiums into earnings announcements (EA) caused by an anticipated rise in Implied Volatility (IV). With this strategy, Buy a Call and Put at-the-money (a long straddle) 2-3 weeks before the EA when IV is lower. Sell the position either (1) the night before the EA when the company announces earnings pre-market, or (2) during the EA day when it announces post-market, generally capturing IV at or close to its peak.

This popular screen will give you a list of stocks whose Options premiums tend to rise into Earnings. It includes only those stocks whose Earnings are at least two weeks away from today.

Screen criteria:

  1. Earnings Date Start Date : Current Date + 15 Days
  2. Earnings Date End Date : Current Date + 30 Days
  3. Predicted Move (Next Day) Min : 5%
  4. Options Type: Weekly or Monthly if that lines up with the two to three-week lead-time for entering the trade

Strategy Guideline:

  1. Buy a Straddle at or close to the money two to three weeks pre-EA.
  2. Sell the position either the night before the EA when the company announces earnings pre-market, or during the EA day when it announces post-market.
  3. Expiration date should generally be the closest expiry immediately after the EA.
  4. Straddle price should not be more 60% of predicted move.

Predicted Move (Volatility)

Similar to Implied Volatility in Options. Expected volatility % based on our Proprietary Volatility Predication Model. We are expecting that stock price will likely to reach % in either direction by the end of next trading session after Earnings are released and not necessarily the closing volatility %.

Why is it important?

    This indicator helps

  1. Knowing expected volatility in stocks after Earnings helps to decide trading stocks before Earnings Announcement.
  2. Taking Advantage of volatility collapse following Earnings Results by using Advance Options strategies such as Spread and Straddles.

Since Last Earnings

Change in share price since last Earnings release.

Why is it Important?

When share has gained more than 10% since it's last Earning release, it tends to over react to minor bad news and give up some gains if not all. So, it contains more downside volatility than upside When share has dropped more than 10% since it's last Earning release, it tends to over react to minor good news and recover some drops if not all. So, it contains more upside volatility than downside.

EPS Surprise (%)

Occurs when a company's reported quarterly or annual profits are above or below analysts' expectations. Here is the formula to derive % EPS Surprice:

Actual EPS - Estimated EPS
------------------------------------- x 100
Estimated EPS

Why is it Important?

Earnings surprises can have a huge impact on a company's stock price. Several studies suggest that positive earnings surprises not only lead to an immediate hike in a stock's price, but also to a gradual increase over time. Hence, it's not surprising that some companies are known for routinely beating earning projections. A negative earnings surprise will usually result in a decline in share price.

Next Day Price Change (%)

Next Regular trading session Closing price following Earnings result.

For After Market Close Earnings, It is a next trading day closing price. For Before Market Open Earnings, It is the same trading day closing price.

Why is it Important?

Next Day price change is a reaction of Earnings result.

OKLO Stock is a Veritable Moonshot But the Smart Money Digs It

Posted on Jul 30, 2026 by Joshua Enomoto

OKLO Stock is a Veritable Moonshot But the Smart Money Digs It

I don’t need to tell you that Oklo (NYSE: OKLO) and the rest of the nuclear energy sector have suffered a sector cooldown. For its part, OKLO stock is down a staggering 44% on a year-to-date basis. What’s worse, there doesn’t seem to be an end to the pain, with the ticker losing nearly 24% just in the past month.

For conservative investors, the wise move is to head to the sidelines. After all, there’s that adage about falling knives and such. But there’s also that phrase that fortune favors the bold — which essentially means that if you’re looking for moonshot opportunities, you’re not going to get it by being passive. And a trade (especially an options trade) in OKLO stock is anything but passive.

Let’s be real here. While the ticker’s 60-month beta of 1.14 doesn’t sound like much volatility, this ticker can eat you alive. For example, in the past 52 weeks, OKLO stock has declined by around 47%. But within this period, there have been multiple peaks and valleys. So, over a relatively short period, you can easily have sharply contrasting opinions about the nuclear power specialist.

That’s really the whole point about options trading for such wild securities. No one is convinced that the current price is the ultimate fair value of OKLO stock. Instead, there are wide-ranging opinions about its valuation, which necessarily means that such analyses imply that market returns are dependent variables.

Exploring the Math Behind OKLO Stock


Without getting into convoluted math, the future direction of OKLO stock is non-deterministic. You can’t come up with a formula, plug some numbers in and then spit out an exact price target at a specific point in time. Part of the reason is that publicly traded equities are by nature reflexive: they respond to the behavior of participants.

Notice the radical paradigm shift between the equities system and the laws of nature. For example, when a ball is launched into the air (assuming that it didn’t go into orbit), it’s going to come back down due to gravity. It doesn’t matter whether you observed the ball or not — gravity is always going to work.

But that assumption cannot be made in the equities market. If OKLO stock jumps higher, for example, it could continue moving higher or it could fall or it could stay rangebound. You just don’t know for sure. What you do know from observation, however, is that prior market behaviors influence the ticker’s forward trajectory.

When a publicly traded company suffers a massive decline, the trading community will respond to it differently than if the organization enjoyed a stratospheric rise. That’s where the dependency comes from. I think we can all agree that major public securities never trade in an isolated vacuum. In other words, where the target ticker goes depends heavily on what just happened.

If you want to explore more, this philosophy is one of the hallmarks of Markov chain applications in the equities market. By understanding how equities transition from one discrete state to another, we can better predict — through inductive analysis — where a public security is likely to end up at a given point in time.

Getting into OKLO’s Projected Numbers

Fundamentally, I’m operating under the presupposition that distortions in order flow balances influence future market outcomes. Since OKLO stock has incurred a significant drop, I’m assuming that algorithmic, rules-based protocols may view the ticker as a discounted opportunity. Subsequently, the theory is that OKLO may bounce higher over the next several weeks.

An intriguing dynamic is the volatility skew for the options chain expiring Sep. 18. It’s clear from a quick visual inspection that the overall trajectory is unambiguously biased toward upside convexity: simply stated, the call skew extends much further out than the put skew. Taking the data at face value, we may reasonably assume that smart money traders are more interested in levering up a possible upswing rather than buying downside insurance.

To be completely transparent, the volatility skew by itself doesn’t provide a probabilistic assessment of what might happen. Just like any other entity in the equities space, major traders and institutions can be caught off-guard by OKLO stock. Further, just because traders are buying upside insurance doesn’t necessarily mean that the security will rise.

At the same time, I don’t want to outright ignore the data. If the most sophisticated traders believe the risk is higher toward not making the most out of a rebound, as opposed to protecting against a catastrophic loss, that implication is noteworthy.
OKLO-StockEarnings

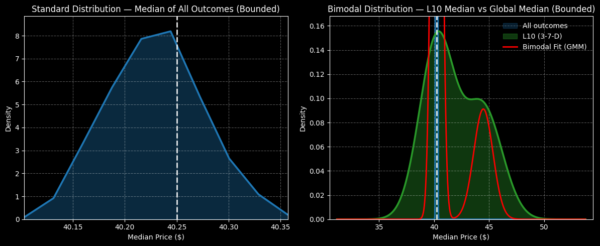
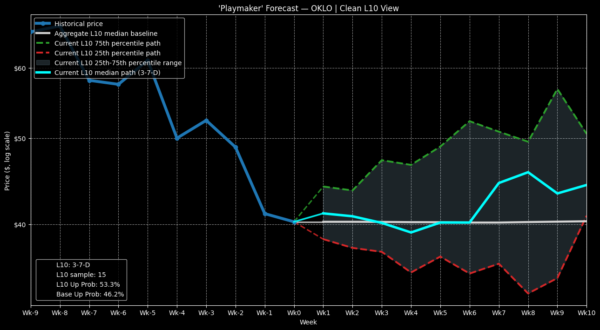
Another enticing factor comes from an empirical inductive analysis of OKLO stock. In the last 10 weeks, OKLO printed only three up weeks, thereby leading to a downward slope. This 3-7-D quantitative sequence has materialized 15 times on a rolling basis since the company’s public market debut and has historically led to an above-average performance over the next 10 weeks relative to holding the security for a 10-week period.

Moreover, the p-value of the aforementioned signal is calculated as 3.17%, which is below the 5% threshold that scientists often use to filter out explanations related to randomness. Basically, there could be an edge by trading this 3-7-D signal.

Identifying an Enticing Options Spread

Based on the inductive data, OKLO stock is likely to encounter a sizable bounce higher on week 8 following the flashing of the aforementioned signal. Given this observed trend, a speculative but compelling idea is the 40/45 bull call spread expiring Sep. 18. For a net debit of $205 per spread, traders will be hoping that OKLO rises through the $45 strike at expiration, triggering the maximum payout of nearly 144%.
OKLO-StockEarnings

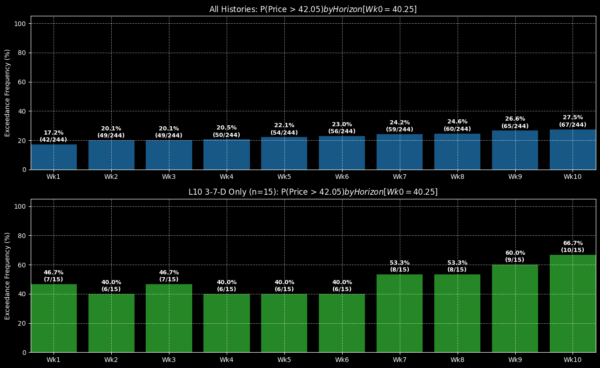
Now, the mathematical meat of this trade centers on the bull spread’s breakeven price of $42.05. As the label suggests, that’s the price OKLO stock needs to hit at expiration for the trade to not lose money. Right now, Wall Street assigns a probability of profit of only 45.2% that this threshold will be met at the time allocated.

However, this probability might not represent the “real” odds. I say that because the figure comes from a Black-Scholes-derived framework, which assumes that future market outcomes are priced according to a risk-neutral, lognormal environment. Basically, the underlying formula cannot take into account the potential influencing factor of OKLO’s recent bearish cycle. Effectively, Black-Scholes is memoryless at the starting point.

My model has a different philosophical framework, namely, that future market returns are dependent variables. I’m analyzing OKLO stock not how it may respond within a theoretical (and imposed) framework but understanding how it actually responds under specific circumstances.
OKLO-StockEarnings

In this case, under the 15 times that the 3-7-D signal has flashed, OKLO has exceeded the equivalent of the $42.05 breakeven price a total of eight times on week 8 (Sep. 18). From an observational and conditional perspective, then, the actual probability of profit may be 53.3%.

Now, the biggest criticism I’m going to face with the application of this model for OKLO stock is the extremely low sample size, which can easily cause distortions. This is where market reality comes into play. Given the limited amount of relevant data to work with, there will always be uncertainty with any model. However, the above approach gives you an alternative perspective to consider.


Joshua Enomoto is a seasoned financial writer with a strong track record of in-depth stock analysis, offering clear, insightful commentary for retail investors across all levels of expertise. Renowned for his ability to blend analytical rigor with engaging wit, Joshua's work has been featured on leading investment platforms, including TipRanks, InvestorPlace, Barchart, Benzinga, and Fintel. He was also handpicked to spearhead high-impact initiatives such as InvestorPlace's "Trade of the Day" and Benzinga’s ETF coverage. As a frequent guest expert for CGTN America, Joshua discusses a wide range of economic, societal, and consumer market trends. A graduate of U.C. San Diego, Joshua brings a thoughtful and fresh perspective to complex financial narratives, helping enterprise clients connect with their audiences. He also composes music in his spare time.

Join over 1.2M+ investors/traders who receive daily and weekly notable earnings alerts with predicted move