ajax loader

Loading...


Ride-the-Wave Strategy – Best for Stock Traders

Ride-the-Wave targets multi-day price momentum following a company’s earnings announcement (EA). With this strategy:

  1. Buy a stock one day post-EA if a stock reacts positively post-earnings:
    1. Near the close of trading the EA-day for a pre-market-EA
    2. Near the close of the following day for a post-market-EA
  2. Sell-to-close after 7-10 days, or possibly earlier if a desired price target is reached

Similarly,

  1. short a stock one day post-EA if a stock reacts negatively post-earnings:
    1. near the close of trading the EA-day for a premarket-EA
    2. near the close of the following day for a post-market-EA
  2. then buy-to-close after 7-10 days, or possibly earlier if a desired price target is reached

Important: Ride-the-Wave is predicated on significant price momentum triggered by an EA. The 7-10 day scenario is the maximum trade hold-time. If you see post EA-momentum is halted or reversed by a significant opposite move, re-evaluate your presence in the trade.

This popular StockEarnings screen below will give you a list of stocks that historically exhibit significant price momentum following an EA for the next seven days:

  1. Stocks exhibiting positive post-EA price moves are buy-candidates
  2. Stocks exhibiting negative post-EA price moves are sell/short-candidates

The screen includes those stocks whose Earnings just came out in last two days.

Screen criteria:

  1. Earnings Date Start Date : Current Date + -1 Day
  2. Earnings Date End Date : Current Date + -2 Days
  3. Predicted Move (Next Day) Max : 7%
  4. Predicted Move (On 7th Day) Min : 7%

Strategy Guideline:

  1. Buy the stock if stock has reacted positively. Short the stock if stock has reacted negatively (see above).
  2. Close the position in 7-10 days, or possibly earlier based on price move.

Volatility Crush Strategy - Best for Options Traders

The Volatility Crush strategy is used with stocks that typically experience relatively low-to-moderate price moves (≤4%) following their Earnings Announcements (EA). The basic trade idea is to sell put or call options right before the EA, collecting a credit when options premium is very high due to elevated implied volatility (IV). You then close the position right after the EA by buying the option back much cheaper due to the significant drop in IV that occurs after the mystery of the EA disappears. In assessing this trade, you need to do your homework to ensure you collect sufficient premium to make the trade worthwhile.

This trade is practical due to the low-to-moderate price-move after the EA, which generally won’t significantly affect the options price, unlike an “action” stock, which experience great price moves post-EA. With these symbols, if you’re on the right side of the price move, that’s a great thing. But if you’re on the wrong side of the move, not so great. Consequently, by minimizing the effect of the post-EA price move, you have a much better chance to profit from the reduction in IV without it being ruined by a violent price move.

For this trade, open the position either (1) the night before the EA when the company announces earnings or (2) during the EA day when it announces post-market, generally capturing IV at or close to its peak.

For this trade, open the position either (1) the night before the EA when the company announces earnings or (2) during the EA day when it announces post-market, generally capturing IV at or close to its peak.

This popular stockearnings screen will give you a list of stocks which do not react more than 4% fpost-EA. It includes only those stocks whose earnings are releasing next day.

Screen criteria:

  1. Earnings Date Start Date : Current Date + 1
  2. Earnings Date End Date : Current Date + 1
  3. Predicted Move (Next Day) Max : 4%
  4. Options Type: Weekly

Strategy Guideline:

  1. Options Strategy: Sell Call and Put
  2. Options Strike Price: Current Stock Price – (% Predicated Move x 2)
  3. Expiration Date: It should generally be the closest expiry immediately after the EA.
  4. Buy Insurance: Buying back Call and Put at Strike price which 10% lower than Sell Strike Price is optional but recommended.

Watch Video for More Detail

Volatility Rush Strategy - Best for Options Traders

The Volatility Rush takes advantage of increasing options premiums into earnings announcements (EA) caused by an anticipated rise in Implied Volatility (IV). With this strategy, Buy a Call and Put at-the-money (a long straddle) 2-3 weeks before the EA when IV is lower. Sell the position either (1) the night before the EA when the company announces earnings pre-market, or (2) during the EA day when it announces post-market, generally capturing IV at or close to its peak.

This popular screen will give you a list of stocks whose Options premiums tend to rise into Earnings. It includes only those stocks whose Earnings are at least two weeks away from today.

Screen criteria:

  1. Earnings Date Start Date : Current Date + 15 Days
  2. Earnings Date End Date : Current Date + 30 Days
  3. Predicted Move (Next Day) Min : 5%
  4. Options Type: Weekly or Monthly if that lines up with the two to three-week lead-time for entering the trade

Strategy Guideline:

  1. Buy a Straddle at or close to the money two to three weeks pre-EA.
  2. Sell the position either the night before the EA when the company announces earnings pre-market, or during the EA day when it announces post-market.
  3. Expiration date should generally be the closest expiry immediately after the EA.
  4. Straddle price should not be more 60% of predicted move.

Predicted Move (Volatility)

Similar to Implied Volatility in Options. Expected volatility % based on our Proprietary Volatility Predication Model. We are expecting that stock price will likely to reach % in either direction by the end of next trading session after Earnings are released and not necessarily the closing volatility %.

Why is it important?

    This indicator helps

  1. Knowing expected volatility in stocks after Earnings helps to decide trading stocks before Earnings Announcement.
  2. Taking Advantage of volatility collapse following Earnings Results by using Advance Options strategies such as Spread and Straddles.

Since Last Earnings

Change in share price since last Earnings release.

Why is it Important?

When share has gained more than 10% since it's last Earning release, it tends to over react to minor bad news and give up some gains if not all. So, it contains more downside volatility than upside When share has dropped more than 10% since it's last Earning release, it tends to over react to minor good news and recover some drops if not all. So, it contains more upside volatility than downside.

EPS Surprise (%)

Occurs when a company's reported quarterly or annual profits are above or below analysts' expectations. Here is the formula to derive % EPS Surprice:

Actual EPS - Estimated EPS
------------------------------------- x 100
Estimated EPS

Why is it Important?

Earnings surprises can have a huge impact on a company's stock price. Several studies suggest that positive earnings surprises not only lead to an immediate hike in a stock's price, but also to a gradual increase over time. Hence, it's not surprising that some companies are known for routinely beating earning projections. A negative earnings surprise will usually result in a decline in share price.

Next Day Price Change (%)

Next Regular trading session Closing price following Earnings result.

For After Market Close Earnings, It is a next trading day closing price. For Before Market Open Earnings, It is the same trading day closing price.

Why is it Important?

Next Day price change is a reaction of Earnings result.

Ford Beats and Raises Guidance — But the Fade Tells the Real Story

Posted on Jul 30, 2026 by Chris Markoch

Ford Beats and Raises Guidance — But the Fade Tells the Real Story

Ford Motor Company (NYSE: F) reported Q2 2026 results that read like a beat on paper but a hold in practice — and the stock’s own trading action on Wednesday made that case better than any analyst could. Adjusted earnings per share (EPS) came in at 42 cents, up from 37 cents a year ago, and the company raised its full-year adjusted EBIT guidance to $10 billion to $11 billion, up from a prior range of $8.5 billion to $10.5 billion.

Shares jumped as much as 8% at the opening bell, riding the after-hours enthusiasm into the regular session. By the closing bell, that gain had shrunk to roughly 2.75%. Some of the fade tracked a broader market selloff, but not all of it. Ford gave back a meaningful chunk of its gain on its own. 
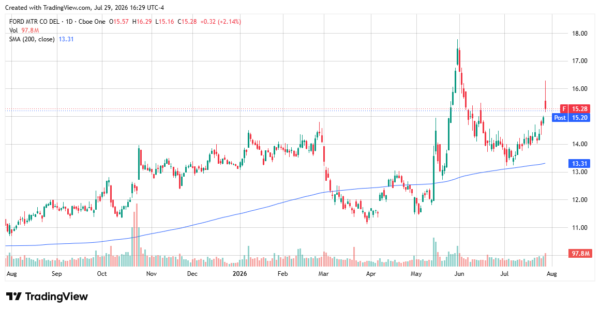
ford - StockEarnings

That could be because when you look past the adjusted numbers, the picture quickly gets murkier. Total revenue was $48.3 billion, down 4% year-over-year, and the company posted a GAAP net loss of $1.3 billion, driven almost entirely by a $3.6 billion charge tied to unwinding its BlueOval SK battery joint venture. 

Perhaps the clearest signal of all came from the boardroom. Ford declared its regular quarterly dividend of 15 cents per share, unchanged. For a company touting “profitable growth,” that’s a tell. If the earnings were strong enough to justify returning more cash to shareholders, this was the quarter to do it. Ford didn’t. 

The Numbers That Matter 


Here’s the full breakdown of the quarter, and where the “beat” actually came from: 

  • Revenue: $48.3 billion, down 4% year-over-year 
  • Adjusted EBIT: $2.5 billion, up 17%, with margin expanding to 5.2% from 4.3% 
  • Adjusted free cash flow: $2.1 billion, down from $2.8 billion a year ago 
  • Adjusted EPS: $0.42, up from $0.37 
  • GAAP EPS: a loss of $0.33, versus a loss of $0.01 a year ago 
  • Net loss attributable to Ford: $1.3 billion 

The gap between the adjusted and GAAP numbers stems from special items. Ford took $4.2 billion in pre-tax special charges this quarter, primarily the BOSK joint venture disposition, plus roughly $500 million tied to previously announced EV program cancellations. Strip those out, and the adjusted profitability picture looks genuinely better than a year ago. Leave them in, and Ford lost money. 
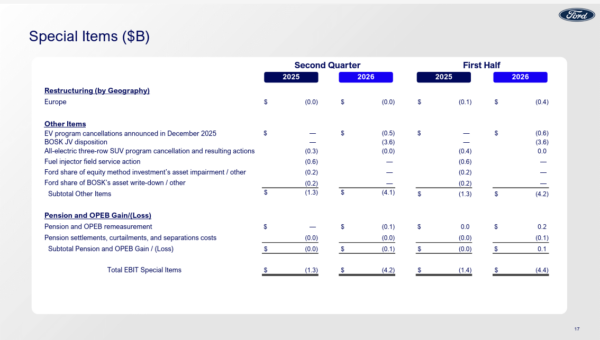
ford - StockEarnings

That’s not a reason to dismiss the adjusted numbers outright. Special items are real accounting treatments, not manipulation, and management doesn’t control the accounting timeline for a battery joint venture unwind. But it’s also not a reason to treat the “beat” as evidence Ford is suddenly firing on all cylinders. Revenue fell for the second time in three quarters, and the profit improvement came entirely from cost control and mix, not from selling more vehicles. 

Where the Margin Improvement Actually Came From 

Segment results explain the disconnect between “more profitable” and “not growing.” Ford Blue, the traditional gas and hybrid business, generated $26.1 billion in revenue and $1.1 billion in EBIT, a 4.4% margin — up from 2.6% a year ago. Volume was down, hurt by product discontinuations and an aluminum supply disruption tied to Ford’s Novelis relationship, but pricing discipline and a richer mix more than offset it. 

Ford Pro, the commercial vehicle unit, posted $17.8 billion in revenue, but EBIT fell to $1.7 billion from $2.3 billion, with the margin compressing to 9.7% from 12.3%. Novelis-related production disruptions hit this segment hardest, since the F-Series lineup runs through Pro’s numbers as well as Blue’s. 

Model e, the EV business, remains a drag but a shrinking one: revenue fell to $1.0 billion, and the segment posted a $0.9 billion EBIT loss — an 89.6% margin, improved from a brutal 56.4% loss margin a year ago (the improvement reflects a smaller EV base overall, not just better unit economics). Ford is right-sizing Mach-E production to actual demand and has discontinued the F-150 Lightning, both of which shrink the absolute loss. 

The Guidance Raise: Real, But Concentrated in One Place 

Ford’s full-year outlook improved across the board: 

  • Adjusted EBIT: $10.0B–$11.0B, up from $8.5B–$10.5B 
  • Adjusted free cash flow: $6.0B–$7.0B, up from $5.0B–$6.0B 
  • Ford Blue segment guidance: $5.0B–$5.5B EBIT, up from $4.5B–$5.0B 
  • Ford Pro segment guidance: $7.0B–$7.5B, up from $6.5B–$7.5B 
  • Model e: losses narrowed to roughly $4.0 billion, from a prior $4.0B–$4.5B range 

Nearly all of the improvement traces back to Ford Blue and better-than-expected pricing across the U.S. industry — management now expects full-year industry pricing up about 0.5%, versus “about flat” previously. Ford also pulled forward some tariff-related cash recovery it previously expected in 2027.

None of this reflects a change in the demand picture. It reflects Ford getting better at extracting profit from a business that isn’t growing. 

The Dividend Is the Tell 

This is the detail that cuts through the noisy headline numbers. Ford’s board declared a third-quarter dividend of 15 cents per share — the same regular dividend rate as prior quarters. That’s better than a cut, but it’s not a signal that management sees enough durable earnings power to return more cash to shareholders right now. 

Companies don’t need to raise dividends every quarter, and holding a payout steady isn’t itself a red flag. But paired with a “beat and raise” headline, a flat dividend reads as management hedging its own enthusiasm. If Ford’s leadership were confident this quarter marked a genuine inflection — not just a good cost-control quarter inside a shrinking top line — a dividend increase would have been the easy, low-risk way to signal it. They didn’t take that opportunity. 

The Investor Psychology Read: The Fade Confirmed the Thesis 

Put it all together, and Ford is doing a better job managing the controllable parts of its business — cost, mix, pricing — while the parts it doesn’t control — vehicle volume, EV demand, aluminum supply — continue to work against it. That’s a legitimate accomplishment. It’s also not the kind of quarter that changes a valuation story, and Wednesday’s trading made that case. 

Part of the stock’s retreat was simply Ford getting pulled down with a broader market selloff. But that doesn’t explain everything. A stock genuinely re-rating on a growth story doesn’t give back the majority of its opening pop on a day when the news itself didn’t change. That kind of fade is what it looks like when the first reaction is relief against a low bar, and the rest of the day is spent recalculating what the numbers actually support. 

Revenue is down. Ford Pro’s margin, the company’s most reliable profit engine, actually compressed. The dividend didn’t move. And the guidance raise, while real, is concentrated almost entirely in “we’re better at pricing and cost than we thought,” not “demand is coming back.” Investors who bought the opening gap on headline enthusiasm had the rest of the session to read the segment detail and the GAAP loss, and a meaningful number of them apparently decided the story didn’t support an 8% move. 

None of this means the stock is a sell. Adjusted ROIC over the trailing four quarters improved to 13.2% from 10.1%, and a $22.3 billion cash position, combined with $43.4 billion in total liquidity, gives Ford plenty of room to keep executing this playbook.

But “better cost discipline inside a shrinking business” and “genuine growth story” are two different theses, and this report is clearly the former. Wednesday’s price action is about as clean a real-time verdict as the market offers on which thesis it’s actually buying. For now, Ford remains a stock stuck in neutral: profitable enough to avoid a selloff, not growing enough to hold onto a rally.


A former marketing copywriter turned freelance financial writer and market analyst. I have a passion for delivering insights to investors. I write regularly about stocks for StockEarnings and MarketBeat. Posts are not advice.

Join over 1.2M+ investors/traders who receive daily and weekly notable earnings alerts with predicted move