ajax loader

Loading...


Ride-the-Wave Strategy – Best for Stock Traders

Ride-the-Wave targets multi-day price momentum following a company’s earnings announcement (EA). With this strategy:

  1. Buy a stock one day post-EA if a stock reacts positively post-earnings:
    1. Near the close of trading the EA-day for a pre-market-EA
    2. Near the close of the following day for a post-market-EA
  2. Sell-to-close after 7-10 days, or possibly earlier if a desired price target is reached

Similarly,

  1. short a stock one day post-EA if a stock reacts negatively post-earnings:
    1. near the close of trading the EA-day for a premarket-EA
    2. near the close of the following day for a post-market-EA
  2. then buy-to-close after 7-10 days, or possibly earlier if a desired price target is reached

Important: Ride-the-Wave is predicated on significant price momentum triggered by an EA. The 7-10 day scenario is the maximum trade hold-time. If you see post EA-momentum is halted or reversed by a significant opposite move, re-evaluate your presence in the trade.

This popular StockEarnings screen below will give you a list of stocks that historically exhibit significant price momentum following an EA for the next seven days:

  1. Stocks exhibiting positive post-EA price moves are buy-candidates
  2. Stocks exhibiting negative post-EA price moves are sell/short-candidates

The screen includes those stocks whose Earnings just came out in last two days.

Screen criteria:

  1. Earnings Date Start Date : Current Date + -1 Day
  2. Earnings Date End Date : Current Date + -2 Days
  3. Predicted Move (Next Day) Max : 7%
  4. Predicted Move (On 7th Day) Min : 7%

Strategy Guideline:

  1. Buy the stock if stock has reacted positively. Short the stock if stock has reacted negatively (see above).
  2. Close the position in 7-10 days, or possibly earlier based on price move.

Volatility Crush Strategy - Best for Options Traders

The Volatility Crush strategy is used with stocks that typically experience relatively low-to-moderate price moves (≤4%) following their Earnings Announcements (EA). The basic trade idea is to sell put or call options right before the EA, collecting a credit when options premium is very high due to elevated implied volatility (IV). You then close the position right after the EA by buying the option back much cheaper due to the significant drop in IV that occurs after the mystery of the EA disappears. In assessing this trade, you need to do your homework to ensure you collect sufficient premium to make the trade worthwhile.

This trade is practical due to the low-to-moderate price-move after the EA, which generally won’t significantly affect the options price, unlike an “action” stock, which experience great price moves post-EA. With these symbols, if you’re on the right side of the price move, that’s a great thing. But if you’re on the wrong side of the move, not so great. Consequently, by minimizing the effect of the post-EA price move, you have a much better chance to profit from the reduction in IV without it being ruined by a violent price move.

For this trade, open the position either (1) the night before the EA when the company announces earnings or (2) during the EA day when it announces post-market, generally capturing IV at or close to its peak.

For this trade, open the position either (1) the night before the EA when the company announces earnings or (2) during the EA day when it announces post-market, generally capturing IV at or close to its peak.

This popular stockearnings screen will give you a list of stocks which do not react more than 4% fpost-EA. It includes only those stocks whose earnings are releasing next day.

Screen criteria:

  1. Earnings Date Start Date : Current Date + 1
  2. Earnings Date End Date : Current Date + 1
  3. Predicted Move (Next Day) Max : 4%
  4. Options Type: Weekly

Strategy Guideline:

  1. Options Strategy: Sell Call and Put
  2. Options Strike Price: Current Stock Price – (% Predicated Move x 2)
  3. Expiration Date: It should generally be the closest expiry immediately after the EA.
  4. Buy Insurance: Buying back Call and Put at Strike price which 10% lower than Sell Strike Price is optional but recommended.

Watch Video for More Detail

Volatility Rush Strategy - Best for Options Traders

The Volatility Rush takes advantage of increasing options premiums into earnings announcements (EA) caused by an anticipated rise in Implied Volatility (IV). With this strategy, Buy a Call and Put at-the-money (a long straddle) 2-3 weeks before the EA when IV is lower. Sell the position either (1) the night before the EA when the company announces earnings pre-market, or (2) during the EA day when it announces post-market, generally capturing IV at or close to its peak.

This popular screen will give you a list of stocks whose Options premiums tend to rise into Earnings. It includes only those stocks whose Earnings are at least two weeks away from today.

Screen criteria:

  1. Earnings Date Start Date : Current Date + 15 Days
  2. Earnings Date End Date : Current Date + 30 Days
  3. Predicted Move (Next Day) Min : 5%
  4. Options Type: Weekly or Monthly if that lines up with the two to three-week lead-time for entering the trade

Strategy Guideline:

  1. Buy a Straddle at or close to the money two to three weeks pre-EA.
  2. Sell the position either the night before the EA when the company announces earnings pre-market, or during the EA day when it announces post-market.
  3. Expiration date should generally be the closest expiry immediately after the EA.
  4. Straddle price should not be more 60% of predicted move.

Predicted Move (Volatility)

Similar to Implied Volatility in Options. Expected volatility % based on our Proprietary Volatility Predication Model. We are expecting that stock price will likely to reach % in either direction by the end of next trading session after Earnings are released and not necessarily the closing volatility %.

Why is it important?

    This indicator helps

  1. Knowing expected volatility in stocks after Earnings helps to decide trading stocks before Earnings Announcement.
  2. Taking Advantage of volatility collapse following Earnings Results by using Advance Options strategies such as Spread and Straddles.

Since Last Earnings

Change in share price since last Earnings release.

Why is it Important?

When share has gained more than 10% since it's last Earning release, it tends to over react to minor bad news and give up some gains if not all. So, it contains more downside volatility than upside When share has dropped more than 10% since it's last Earning release, it tends to over react to minor good news and recover some drops if not all. So, it contains more upside volatility than downside.

EPS Surprise (%)

Occurs when a company's reported quarterly or annual profits are above or below analysts' expectations. Here is the formula to derive % EPS Surprice:

Actual EPS - Estimated EPS
------------------------------------- x 100
Estimated EPS

Why is it Important?

Earnings surprises can have a huge impact on a company's stock price. Several studies suggest that positive earnings surprises not only lead to an immediate hike in a stock's price, but also to a gradual increase over time. Hence, it's not surprising that some companies are known for routinely beating earning projections. A negative earnings surprise will usually result in a decline in share price.

Next Day Price Change (%)

Next Regular trading session Closing price following Earnings result.

For After Market Close Earnings, It is a next trading day closing price. For Before Market Open Earnings, It is the same trading day closing price.

Why is it Important?

Next Day price change is a reaction of Earnings result.

Microsoft Is Having One Of Its Weakest Years In Decades

Posted on Jul 07, 2026 by Grayson Cavern

Microsoft Is Having One Of Its Weakest Years In Decades

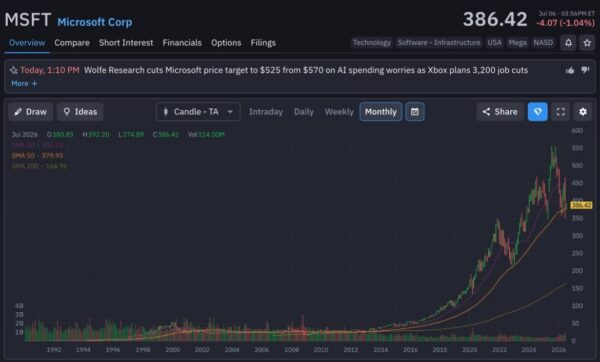
Mention Microsoft’s biggest corrections and most investors instinctively revisit the dot-com era. It’s an understandable reaction. The 2000 collapse remains one of the defining episodes in the company’s history, trapping shareholders in a stock that needed more than a decade to reclaim its previous highs despite continuing to generate billions of dollars in profits along the way. Microsoft’s latest first-half decline of 18.25% ranks among its weakest starts since then, inviting comparisons that feel obvious on the surface.  I think that’s where investors are asking the wrong question.

The debate surrounding Microsoft Corp. (NASDAQ: MSFT) today has little to do with the one investors faced twenty-five years ago. The chart may evoke uncomfortable memories, but the business underneath it tells an entirely different story. And the market isn’t reliving the dot-com bubble either. It’s trying to determine how long it should finance one of the largest artificial intelligence investment cycles in corporate history before demanding those investments produce equally extraordinary returns.

History Didn’t Punish Microsoft. It Punished Expectations.


Microsoft’s rise into early 2000 reflected genuine business strength. Windows dominated personal computing, Office had become indispensable and revenue kept expanding. None of those achievements protected shareholders from what followed because the stock had already discounted years of future success before those profits arrived.

The numbers tell the same story. Microsoft’s first-half return in 2000 fell 30.56%, considerably worse than this year’s decline, yet the company’s business continued generating cash throughout much of the following decade. Investors weren’t paying for Microsoft’s present. They had already paid for its future.  

That’s the investing lesson I take from 2000. Exceptional companies don’t automatically produce exceptional investments. Sometimes the valuation reaches tomorrow long before the business does.
microsoft-StockEarnings

Today’s Debate Revolves Around Time, Not Technology

Microsoft Corp. (NASDAQ: MSFT) enters this correction from a position of enormous strength rather than uncertainty.

The company generated $70.1 billion in quarterly revenue during its latest fiscal third quarter, with revenue climbing 13% year over year. Azure and other cloud services continued expanding, Microsoft Cloud revenue reached $42.4 billion, operating income rose 16%, and the company returned billions to shareholders while continuing one of the largest capital investment programs anywhere in corporate America. These figures describe a company spending aggressively to secure what management believes will become the next computing platform. That’s exactly why Wolfe Research’s recent decision to reduce its price target from $570 to $525, attracted so much attention. In fact, the stock dipped 1.5% afterwards. As a result of the company’s surging memory prices leading to an increase in its fiscal 2027 capital expenditure projections to $270 billion from $230 billion. So Wolfe Research wasn’t just questioning Microsoft’s competitive position. It questioned whether the pace of AI spending was beginning to outdistance investors’ willingness to wait for the financial payoff.

Keep that in mind because now, Microsoft has to demonstrate the economics can mature as quickly as the ambitions.

The Chart Says Institutions Are Repricing Patience

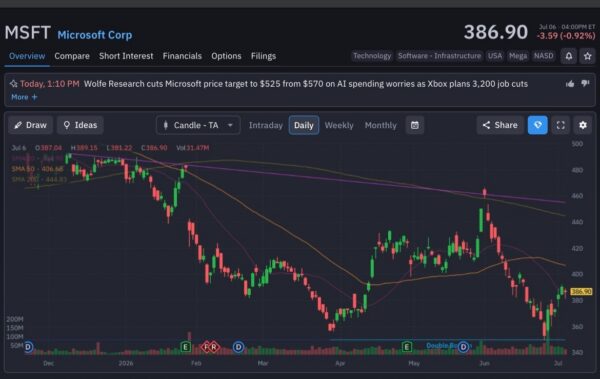
After climbing toward $460 in June, Microsoft encountered heavy selling pressure that carried shares back toward the $350 area before buyers stepped in decisively. Since then, the stock has reclaimed its 20-day moving average and begun challenging resistance around the declining 50-day average. The longer-term 200-day average still sits well overhead, reminding investors that confidence hasn’t fully returned despite the recovery. That price action tells me institutions are doing something far more nuanced than abandoning Microsoft. They’re recalibrating what they’re willing to pay while the company spends unprecedented amounts building AI infrastructure whose ultimate returns remain difficult to measure today.

Don’t get me wrong, the correction isn’t  destroying Microsoft’s long-term trend. All I’m saying is that it is compressing the premium investors were previously willing to assign to that trend. That’s a very different message.
microsoft-StockEarnings

What I’ll Be Watching

History deserves respect, but it rarely deserves imitation.

Microsoft’s first-half performance certainly belongs among its weakest in decades, yet every major decline listed in the historical record emerged from a different backdrop. The dot-com bubble, the financial crisis, post-crisis uncertainty, aggressive Federal Reserve tightening and today’s AI investment cycle all forced investors to reassess future expectations for different reasons.  

That’s why I find the comparison to 2000 useful but only up to a point. The resemblance begins with investor psychology and ends with the business itself. Over the next several quarters, my attention won’t be fixed on whether Microsoft’s share price finally erases this year’s decline. I’ll be watching whether Azure continues accelerating, whether AI products begin contributing meaningfully to earnings growth, whether capital expenditures start translating into proportionally stronger cash generation and whether management can gradually shorten the distance between extraordinary investment and extraordinary financial returns, because that’s ultimately what this correction is asking investors to price.


Join over 1.2M+ investors/traders who receive daily and weekly notable earnings alerts with predicted move