ajax loader

Loading...


Ride-the-Wave Strategy – Best for Stock Traders

Ride-the-Wave targets multi-day price momentum following a company’s earnings announcement (EA). With this strategy:

  1. Buy a stock one day post-EA if a stock reacts positively post-earnings:
    1. Near the close of trading the EA-day for a pre-market-EA
    2. Near the close of the following day for a post-market-EA
  2. Sell-to-close after 7-10 days, or possibly earlier if a desired price target is reached

Similarly,

  1. short a stock one day post-EA if a stock reacts negatively post-earnings:
    1. near the close of trading the EA-day for a premarket-EA
    2. near the close of the following day for a post-market-EA
  2. then buy-to-close after 7-10 days, or possibly earlier if a desired price target is reached

Important: Ride-the-Wave is predicated on significant price momentum triggered by an EA. The 7-10 day scenario is the maximum trade hold-time. If you see post EA-momentum is halted or reversed by a significant opposite move, re-evaluate your presence in the trade.

This popular StockEarnings screen below will give you a list of stocks that historically exhibit significant price momentum following an EA for the next seven days:

  1. Stocks exhibiting positive post-EA price moves are buy-candidates
  2. Stocks exhibiting negative post-EA price moves are sell/short-candidates

The screen includes those stocks whose Earnings just came out in last two days.

Screen criteria:

  1. Earnings Date Start Date : Current Date + -1 Day
  2. Earnings Date End Date : Current Date + -2 Days
  3. Predicted Move (Next Day) Max : 7%
  4. Predicted Move (On 7th Day) Min : 7%

Strategy Guideline:

  1. Buy the stock if stock has reacted positively. Short the stock if stock has reacted negatively (see above).
  2. Close the position in 7-10 days, or possibly earlier based on price move.

Volatility Crush Strategy - Best for Options Traders

The Volatility Crush strategy is used with stocks that typically experience relatively low-to-moderate price moves (≤4%) following their Earnings Announcements (EA). The basic trade idea is to sell put or call options right before the EA, collecting a credit when options premium is very high due to elevated implied volatility (IV). You then close the position right after the EA by buying the option back much cheaper due to the significant drop in IV that occurs after the mystery of the EA disappears. In assessing this trade, you need to do your homework to ensure you collect sufficient premium to make the trade worthwhile.

This trade is practical due to the low-to-moderate price-move after the EA, which generally won’t significantly affect the options price, unlike an “action” stock, which experience great price moves post-EA. With these symbols, if you’re on the right side of the price move, that’s a great thing. But if you’re on the wrong side of the move, not so great. Consequently, by minimizing the effect of the post-EA price move, you have a much better chance to profit from the reduction in IV without it being ruined by a violent price move.

For this trade, open the position either (1) the night before the EA when the company announces earnings or (2) during the EA day when it announces post-market, generally capturing IV at or close to its peak.

For this trade, open the position either (1) the night before the EA when the company announces earnings or (2) during the EA day when it announces post-market, generally capturing IV at or close to its peak.

This popular stockearnings screen will give you a list of stocks which do not react more than 4% fpost-EA. It includes only those stocks whose earnings are releasing next day.

Screen criteria:

  1. Earnings Date Start Date : Current Date + 1
  2. Earnings Date End Date : Current Date + 1
  3. Predicted Move (Next Day) Max : 4%
  4. Options Type: Weekly

Strategy Guideline:

  1. Options Strategy: Sell Call and Put
  2. Options Strike Price: Current Stock Price – (% Predicated Move x 2)
  3. Expiration Date: It should generally be the closest expiry immediately after the EA.
  4. Buy Insurance: Buying back Call and Put at Strike price which 10% lower than Sell Strike Price is optional but recommended.

Watch Video for More Detail

Volatility Rush Strategy - Best for Options Traders

The Volatility Rush takes advantage of increasing options premiums into earnings announcements (EA) caused by an anticipated rise in Implied Volatility (IV). With this strategy, Buy a Call and Put at-the-money (a long straddle) 2-3 weeks before the EA when IV is lower. Sell the position either (1) the night before the EA when the company announces earnings pre-market, or (2) during the EA day when it announces post-market, generally capturing IV at or close to its peak.

This popular screen will give you a list of stocks whose Options premiums tend to rise into Earnings. It includes only those stocks whose Earnings are at least two weeks away from today.

Screen criteria:

  1. Earnings Date Start Date : Current Date + 15 Days
  2. Earnings Date End Date : Current Date + 30 Days
  3. Predicted Move (Next Day) Min : 5%
  4. Options Type: Weekly or Monthly if that lines up with the two to three-week lead-time for entering the trade

Strategy Guideline:

  1. Buy a Straddle at or close to the money two to three weeks pre-EA.
  2. Sell the position either the night before the EA when the company announces earnings pre-market, or during the EA day when it announces post-market.
  3. Expiration date should generally be the closest expiry immediately after the EA.
  4. Straddle price should not be more 60% of predicted move.

Predicted Move (Volatility)

Similar to Implied Volatility in Options. Expected volatility % based on our Proprietary Volatility Predication Model. We are expecting that stock price will likely to reach % in either direction by the end of next trading session after Earnings are released and not necessarily the closing volatility %.

Why is it important?

    This indicator helps

  1. Knowing expected volatility in stocks after Earnings helps to decide trading stocks before Earnings Announcement.
  2. Taking Advantage of volatility collapse following Earnings Results by using Advance Options strategies such as Spread and Straddles.

Since Last Earnings

Change in share price since last Earnings release.

Why is it Important?

When share has gained more than 10% since it's last Earning release, it tends to over react to minor bad news and give up some gains if not all. So, it contains more downside volatility than upside When share has dropped more than 10% since it's last Earning release, it tends to over react to minor good news and recover some drops if not all. So, it contains more upside volatility than downside.

EPS Surprise (%)

Occurs when a company's reported quarterly or annual profits are above or below analysts' expectations. Here is the formula to derive % EPS Surprice:

Actual EPS - Estimated EPS
------------------------------------- x 100
Estimated EPS

Why is it Important?

Earnings surprises can have a huge impact on a company's stock price. Several studies suggest that positive earnings surprises not only lead to an immediate hike in a stock's price, but also to a gradual increase over time. Hence, it's not surprising that some companies are known for routinely beating earning projections. A negative earnings surprise will usually result in a decline in share price.

Next Day Price Change (%)

Next Regular trading session Closing price following Earnings result.

For After Market Close Earnings, It is a next trading day closing price. For Before Market Open Earnings, It is the same trading day closing price.

Why is it Important?

Next Day price change is a reaction of Earnings result.

General Mills Stock: Cheap Value or Value Trap?

Posted on Jul 09, 2026 by Chris Markoch

General Mills Stock: Cheap Value or Value Trap?

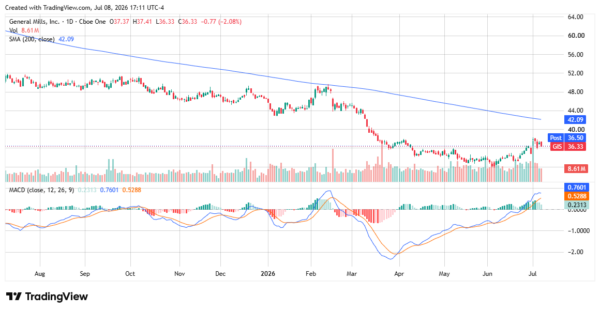
General Mills (NYSE: GIS) isn’t a stock you trade. It’s a stock you own. That distinction matters more than ever after the company’s fiscal 2026 fourth-quarter report, released July 1. Shares sit near their 2026 lows around $36, well below the stock’s 200-day moving average of roughly $42. However, the dividend yields close to 6.7% at current prices. For income investors willing to look past a rough year, that combination of depressed price and dependable payout is worth a second look.

A yield that high can be a warning sign. Elevated yields often precede a dividend cut, especially in consumer staples names fighting volume declines. But General Mills’ payout looks safer than the yield alone suggests. Coverage remains intact, and management has laid out a multi-year cost-cutting plan designed to protect it. The bull case here isn’t about a near-term turnaround. It’s about getting paid to wait for one.

The Numbers Behind the Story


Fiscal Q4 organic net sales came in flat, an improvement from the 2% organic decline for the full fiscal year. Adjusted operating profit jumped 13% in the quarter, and adjusted diluted EPS rose 27%. Both numbers benefited from an extra week in the reporting period and favorable trade expense timing. Strip those tailwinds away, and the underlying trend looks less impressive. Full-year adjusted operating profit fell 16%, matching the decline in adjusted diluted EPS to $3.55.

Margins make the story even uglier. Adjusted gross margin slipped to 33.5% from 34.5% a year ago, largely on higher input costs. Adjusted operating profit margin fell further, from 17.2% to 15.3%. Management blamed a mix of cost inflation, softer volumes, and heavier marketing spending, particularly in the North America Pet segment.

Pet is worth flagging on its own. It had been a growth engine in recent quarters, but organic net sales there declined 3% in both the fourth quarter and the full year, driven by retailer inventory changes. That’s a shift investors should watch closely in the coming quarters.

Guidance Sets a Cautious Bar

Fiscal 2027 guidance calls for organic net sales of -1.5% to +0.5%, adjusted operating profit down 8% to 13%, and adjusted diluted EPS of $3 to $3.20. That means earnings are expected to decline again next year, even after this year’s drop. Management attributes roughly nine points of the operating profit headwind to lapping the extra week, normalizing incentive compensation, and the impact of the completed U.S. yogurt divestiture.

Offsetting that, General Mills is targeting $750 million in cost savings for fiscal 2027, part of a broader plan to reach $3 billion in cumulative savings by fiscal 2030. Free cash flow conversion is guided near 95%, though fiscal 2026 operating cash flow actually declined to $2.166 billion from $2.918 billion the year before.

The Buyback and Dividend Picture

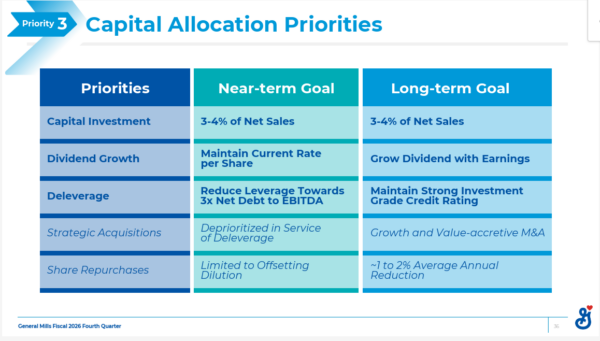
General Mills repurchased $500 million of stock and paid $1.315 billion in dividends during fiscal 2026. That combination reduces the share count over time, which helps offset the cost of future dividend increases. But investors shouldn’t expect an aggressive near-term buyback push. Management’s own capital allocation framework lists share repurchases as “limited to offsetting dilution” in the near term, with the more meaningful 1% to 2% average annual share reduction reserved as a longer-term goal.

Deleveraging toward a 3x net-debt-to-EBITDA target currently takes priority, and even strategic acquisitions have been deprioritized in service of that goal. The dividend itself is being held at its current per-share rate for now, not grown, while the balance sheet gets repaired.
general mills - StockEarnings

Why the Valuation Still Works

At roughly 11 to 12 times fiscal 2027 guided earnings, General Mills trades well below its own historical average and below the broader consumer staples sector. That’s not a stock that’s cheap simply because it trades under $50 a share. It’s genuinely inexpensive relative to its own cash-generating capacity, assuming the cost-savings program delivers as promised.

The bear case is straightforward. Category growth across packaged food remains slow. Consumers are trading down to private label, and General Mills has explicitly cited weight-loss trends and shifting consumer health perceptions as ongoing risk factors in its own filings. If that behavioral shift proves structural rather than cyclical, volume pressure could persist longer than management expects.

Technically, there are early signs of stabilization. The stock’s MACD has turned positive for the first time since early 2026, suggesting selling pressure may be easing even though the price remains below the long-term moving average.
general mills - StockEarnings

Consumer Psychology Will Ultimately Decide GIS Stock’s Next Chapter

If shoppers have permanently decided that store brands match General Mills’ quality, that’s a real long-term problem. However, if this is simply a cyclical squeeze from inflation and gas prices, the setup here is straightforward: collect a well-covered dividend, let buybacks work in the background, and wait for volumes to normalize.

Until that question is answered, General Mills remains a name to own patiently rather than trade actively.


A former marketing copywriter turned freelance financial writer and market analyst. I have a passion for delivering insights to investors. I write regularly about stocks for StockEarnings and MarketBeat. Posts are not advice.

Join over 1.2M+ investors/traders who receive daily and weekly notable earnings alerts with predicted move