ajax loader

Loading...


Ride-the-Wave Strategy – Best for Stock Traders

Ride-the-Wave targets multi-day price momentum following a company’s earnings announcement (EA). With this strategy:

  1. Buy a stock one day post-EA if a stock reacts positively post-earnings:
    1. Near the close of trading the EA-day for a pre-market-EA
    2. Near the close of the following day for a post-market-EA
  2. Sell-to-close after 7-10 days, or possibly earlier if a desired price target is reached

Similarly,

  1. short a stock one day post-EA if a stock reacts negatively post-earnings:
    1. near the close of trading the EA-day for a premarket-EA
    2. near the close of the following day for a post-market-EA
  2. then buy-to-close after 7-10 days, or possibly earlier if a desired price target is reached

Important: Ride-the-Wave is predicated on significant price momentum triggered by an EA. The 7-10 day scenario is the maximum trade hold-time. If you see post EA-momentum is halted or reversed by a significant opposite move, re-evaluate your presence in the trade.

This popular StockEarnings screen below will give you a list of stocks that historically exhibit significant price momentum following an EA for the next seven days:

  1. Stocks exhibiting positive post-EA price moves are buy-candidates
  2. Stocks exhibiting negative post-EA price moves are sell/short-candidates

The screen includes those stocks whose Earnings just came out in last two days.

Screen criteria:

  1. Earnings Date Start Date : Current Date + -1 Day
  2. Earnings Date End Date : Current Date + -2 Days
  3. Predicted Move (Next Day) Max : 7%
  4. Predicted Move (On 7th Day) Min : 7%

Strategy Guideline:

  1. Buy the stock if stock has reacted positively. Short the stock if stock has reacted negatively (see above).
  2. Close the position in 7-10 days, or possibly earlier based on price move.

Volatility Crush Strategy - Best for Options Traders

The Volatility Crush strategy is used with stocks that typically experience relatively low-to-moderate price moves (≤4%) following their Earnings Announcements (EA). The basic trade idea is to sell put or call options right before the EA, collecting a credit when options premium is very high due to elevated implied volatility (IV). You then close the position right after the EA by buying the option back much cheaper due to the significant drop in IV that occurs after the mystery of the EA disappears. In assessing this trade, you need to do your homework to ensure you collect sufficient premium to make the trade worthwhile.

This trade is practical due to the low-to-moderate price-move after the EA, which generally won’t significantly affect the options price, unlike an “action” stock, which experience great price moves post-EA. With these symbols, if you’re on the right side of the price move, that’s a great thing. But if you’re on the wrong side of the move, not so great. Consequently, by minimizing the effect of the post-EA price move, you have a much better chance to profit from the reduction in IV without it being ruined by a violent price move.

For this trade, open the position either (1) the night before the EA when the company announces earnings or (2) during the EA day when it announces post-market, generally capturing IV at or close to its peak.

For this trade, open the position either (1) the night before the EA when the company announces earnings or (2) during the EA day when it announces post-market, generally capturing IV at or close to its peak.

This popular stockearnings screen will give you a list of stocks which do not react more than 4% fpost-EA. It includes only those stocks whose earnings are releasing next day.

Screen criteria:

  1. Earnings Date Start Date : Current Date + 1
  2. Earnings Date End Date : Current Date + 1
  3. Predicted Move (Next Day) Max : 4%
  4. Options Type: Weekly

Strategy Guideline:

  1. Options Strategy: Sell Call and Put
  2. Options Strike Price: Current Stock Price – (% Predicated Move x 2)
  3. Expiration Date: It should generally be the closest expiry immediately after the EA.
  4. Buy Insurance: Buying back Call and Put at Strike price which 10% lower than Sell Strike Price is optional but recommended.

Watch Video for More Detail

Volatility Rush Strategy - Best for Options Traders

The Volatility Rush takes advantage of increasing options premiums into earnings announcements (EA) caused by an anticipated rise in Implied Volatility (IV). With this strategy, Buy a Call and Put at-the-money (a long straddle) 2-3 weeks before the EA when IV is lower. Sell the position either (1) the night before the EA when the company announces earnings pre-market, or (2) during the EA day when it announces post-market, generally capturing IV at or close to its peak.

This popular screen will give you a list of stocks whose Options premiums tend to rise into Earnings. It includes only those stocks whose Earnings are at least two weeks away from today.

Screen criteria:

  1. Earnings Date Start Date : Current Date + 15 Days
  2. Earnings Date End Date : Current Date + 30 Days
  3. Predicted Move (Next Day) Min : 5%
  4. Options Type: Weekly or Monthly if that lines up with the two to three-week lead-time for entering the trade

Strategy Guideline:

  1. Buy a Straddle at or close to the money two to three weeks pre-EA.
  2. Sell the position either the night before the EA when the company announces earnings pre-market, or during the EA day when it announces post-market.
  3. Expiration date should generally be the closest expiry immediately after the EA.
  4. Straddle price should not be more 60% of predicted move.

Predicted Move (Volatility)

Similar to Implied Volatility in Options. Expected volatility % based on our Proprietary Volatility Predication Model. We are expecting that stock price will likely to reach % in either direction by the end of next trading session after Earnings are released and not necessarily the closing volatility %.

Why is it important?

    This indicator helps

  1. Knowing expected volatility in stocks after Earnings helps to decide trading stocks before Earnings Announcement.
  2. Taking Advantage of volatility collapse following Earnings Results by using Advance Options strategies such as Spread and Straddles.

Since Last Earnings

Change in share price since last Earnings release.

Why is it Important?

When share has gained more than 10% since it's last Earning release, it tends to over react to minor bad news and give up some gains if not all. So, it contains more downside volatility than upside When share has dropped more than 10% since it's last Earning release, it tends to over react to minor good news and recover some drops if not all. So, it contains more upside volatility than downside.

EPS Surprise (%)

Occurs when a company's reported quarterly or annual profits are above or below analysts' expectations. Here is the formula to derive % EPS Surprice:

Actual EPS - Estimated EPS
------------------------------------- x 100
Estimated EPS

Why is it Important?

Earnings surprises can have a huge impact on a company's stock price. Several studies suggest that positive earnings surprises not only lead to an immediate hike in a stock's price, but also to a gradual increase over time. Hence, it's not surprising that some companies are known for routinely beating earning projections. A negative earnings surprise will usually result in a decline in share price.

Next Day Price Change (%)

Next Regular trading session Closing price following Earnings result.

For After Market Close Earnings, It is a next trading day closing price. For Before Market Open Earnings, It is the same trading day closing price.

Why is it Important?

Next Day price change is a reaction of Earnings result.

With Exxon Mobil (XOM) Stock Down Big Recently, Is Now the Time to Buy?

Posted on Jul 08, 2026 by Joshua Enomoto

With Exxon Mobil (XOM) Stock Down Big Recently, Is Now the Time to Buy?

Exxon Mobil (NYSE: XOM) easily ranks among the most difficult investments to assess thanks to the shifting tides of the Iran war. However, with cooler heads finally prevailing in the conflict, a serious question mark hanging over XOM stock has been significantly mitigated. Assuming that tensions continue to unwind in somewhat of a transparent manner, the integrated oil market could be intriguing from a structural or mechanical perspective.

By that, I mean that I don’t want to focus on the fundamentals impacting XOM stock. Such a statement might sound sacrilegious but there are three incontrovertible conclusions that any intellectually honest analyst reaches:

  • The market has digested all possible catalysts.
  • In case of partial digestion, you are never sure what the market has or has not digested.
  • Even if you are sure, the market might not care.

Invariably, the financial publication industry thrives on insights and correlations found in various companies’ quarterly statements and other material corporate disclosures. But the problem here is that the era of analysts in nice suits pouring over corporate literature has mostly faded. Today, trading decisions occur in nanoseconds thanks to high-frequency algorithms.

Let’s also be real here: it’s highly unlikely that random independent contributors (like yours truly) are able to extract profound insights that Wall Street completely missed. As smart as we might think we are, we are always operating downstream of the information flow. Therefore, whatever I have to say about XOM stock has long been integrated into the share price.

Even if that were not the case, there’s no telling what the Street has or has not accounted for. Because XOM stock lost 10% in the trailing month, you’ll almost surely come across analysts that declare that the selloff is overdone. But that statement assumes knowledge of a true intrinsic value of XOM stock that thousands upon thousands of professional investors missed — but somehow Bob from Arkansas got right.

Forgive me but I find that premise to be implausible. And even if valid, the market can ignore your precious insights far longer than you can stay solvent. That’s the cruel reality of a non-determinative system.

A Spotlight on the Market Mechanics of XOM Stock


Since analyzing the fundamentals will likely be a fool’s errand for a flagship equity like Exxon Mobil stock, arguably the best approach (i.e. the least crappiest) is to focus on XOM’s market mechanics. In other words, I don’t think the oil company’s PE ratio is the fulcrum for where shares will head next. Rather, we’re left with observing how XOM responds to certain triggers.

One of those triggers (in my opinion) is the mean-reversion theory. As stated earlier, XOM stock has lost 10% in the trailing month. Since the end of March, the security is down roughly 20%. Yes, as a vibe, most people might say that Exxon Mobil’s selloff is overdone. Thanks to modern technology, though, we can measure these assumptions and build a probabilistic, forward-looking framework.

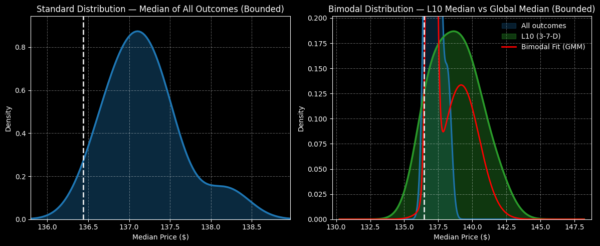
From a quantitative perspective, Exxon Mobil stock has printed only three up weeks in the last 10 weeks, leading to an overall downward slope. Conditioned for this 3-7-D sequence (using a dataset going back to January 2019), bullish traders may expect a forward 10-week distribution landing between $133 and $145, with probability density peaking at around $138.50 (assuming a starting price of $136.44, Monday’s close).
exxon mobil-StockEarnings

Why is this distribution of likely outcomes significant? Because under random conditions, buying XOM stock (at the same price above) and holding the security for 10 weeks leads to a forward distribution between $136 and $139, with probability density peaking at $137.20. Because the risk-reward curve expands net bullishly under 3-7-D conditions, there’s a theoretical incentive to buy XOM stock right now for a (short-term) swing trade.

Of course, the question comes up about why this analysis should matter? The answer is that because all catalysts (both positive and negative) have been priced into the XOM stock price, there’s no edge that reading yesterday’s newspaper can provide. As such, the only real edge that is relevant is the mechanical one.

I’m demonstrating here that under a specific bearish state (i.e. the 3-7-D sequence), the chance of a positive mean reversion occurring is elevated — and that the median expected performance often results in a net return that is typically greater than the random baseline.

Going for a Specific Trade

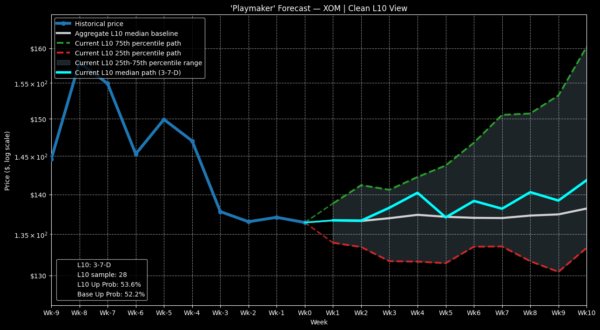
Although the expected distribution for the above signal is tempting for speculators, the projected upside is not expected to follow an orderly, linear trajectory. From prior observations, the fourth week features a sizable pop before somewhat fading. As such, I’m interested in the 138/141 bull call spread expiring July 31.

If we take the inductive logic above at face value, the $141 price target is a realistic objective. If XOM stock manages to rise through this second-leg strike at expiration, the maximum payout stands at over 105%. Further, the breakeven price for this spread comes in at $139.46, providing some margin for safety.
exxon mobil-StockEarnings

What makes this trade a contrarian proposition is that the Black-Scholes model pegs the probability of XOM stock breaking even at only 38.3%. However, this calculation largely stems from how many standard deviations the target threshold is away from spot, assuming a log-normal distribution of outcomes. It’s this latter point which I have a significant disagreement with.

My theory is that stocks do not necessarily follow a log-normal, risk-neutral distribution. Rather, when risk is heavily concentrated — as it is with Exxon Mobil stock thanks to its recent underperformance — there’s a greater reactive risk of the security bouncing higher due to mean reversion.

The key distinction with my analysis compared to the rest of the finpub industry is that I’m not just saying XOM stock will rise higher due to mean reversion. Instead, I’m using past empirical data conditioned for a specific bearish sequence to calculate forward tendencies.

Of course, the main risk with any inductive model is that the uniformity of nature cannot be assumed. Basically, I’m hoping this time will be the same but it could also be different. I’m just relying on the mechanical tendencies of the market to help steer me correctly more times than incorrectly.

If you accept this premise, Exxon Mobil stock could be very intriguing over the next few weeks.

Joshua Enomoto is a seasoned financial writer with a strong track record of in-depth stock analysis, offering clear, insightful commentary for retail investors across all levels of expertise. Renowned for his ability to blend analytical rigor with engaging wit, Joshua's work has been featured on leading investment platforms, including TipRanks, InvestorPlace, Barchart, Benzinga, and Fintel. He was also handpicked to spearhead high-impact initiatives such as InvestorPlace's "Trade of the Day" and Benzinga’s ETF coverage. As a frequent guest expert for CGTN America, Joshua discusses a wide range of economic, societal, and consumer market trends. A graduate of U.C. San Diego, Joshua brings a thoughtful and fresh perspective to complex financial narratives, helping enterprise clients connect with their audiences. He also composes music in his spare time.

Join over 1.2M+ investors/traders who receive daily and weekly notable earnings alerts with predicted move
