ajax loader

Loading...


Ride-the-Wave Strategy – Best for Stock Traders

Ride-the-Wave targets multi-day price momentum following a company’s earnings announcement (EA). With this strategy:

  1. Buy a stock one day post-EA if a stock reacts positively post-earnings:
    1. Near the close of trading the EA-day for a pre-market-EA
    2. Near the close of the following day for a post-market-EA
  2. Sell-to-close after 7-10 days, or possibly earlier if a desired price target is reached

Similarly,

  1. short a stock one day post-EA if a stock reacts negatively post-earnings:
    1. near the close of trading the EA-day for a premarket-EA
    2. near the close of the following day for a post-market-EA
  2. then buy-to-close after 7-10 days, or possibly earlier if a desired price target is reached

Important: Ride-the-Wave is predicated on significant price momentum triggered by an EA. The 7-10 day scenario is the maximum trade hold-time. If you see post EA-momentum is halted or reversed by a significant opposite move, re-evaluate your presence in the trade.

This popular StockEarnings screen below will give you a list of stocks that historically exhibit significant price momentum following an EA for the next seven days:

  1. Stocks exhibiting positive post-EA price moves are buy-candidates
  2. Stocks exhibiting negative post-EA price moves are sell/short-candidates

The screen includes those stocks whose Earnings just came out in last two days.

Screen criteria:

  1. Earnings Date Start Date : Current Date + -1 Day
  2. Earnings Date End Date : Current Date + -2 Days
  3. Predicted Move (Next Day) Max : 7%
  4. Predicted Move (On 7th Day) Min : 7%

Strategy Guideline:

  1. Buy the stock if stock has reacted positively. Short the stock if stock has reacted negatively (see above).
  2. Close the position in 7-10 days, or possibly earlier based on price move.

Volatility Crush Strategy - Best for Options Traders

The Volatility Crush strategy is used with stocks that typically experience relatively low-to-moderate price moves (≤4%) following their Earnings Announcements (EA). The basic trade idea is to sell put or call options right before the EA, collecting a credit when options premium is very high due to elevated implied volatility (IV). You then close the position right after the EA by buying the option back much cheaper due to the significant drop in IV that occurs after the mystery of the EA disappears. In assessing this trade, you need to do your homework to ensure you collect sufficient premium to make the trade worthwhile.

This trade is practical due to the low-to-moderate price-move after the EA, which generally won’t significantly affect the options price, unlike an “action” stock, which experience great price moves post-EA. With these symbols, if you’re on the right side of the price move, that’s a great thing. But if you’re on the wrong side of the move, not so great. Consequently, by minimizing the effect of the post-EA price move, you have a much better chance to profit from the reduction in IV without it being ruined by a violent price move.

For this trade, open the position either (1) the night before the EA when the company announces earnings or (2) during the EA day when it announces post-market, generally capturing IV at or close to its peak.

For this trade, open the position either (1) the night before the EA when the company announces earnings or (2) during the EA day when it announces post-market, generally capturing IV at or close to its peak.

This popular stockearnings screen will give you a list of stocks which do not react more than 4% fpost-EA. It includes only those stocks whose earnings are releasing next day.

Screen criteria:

  1. Earnings Date Start Date : Current Date + 1
  2. Earnings Date End Date : Current Date + 1
  3. Predicted Move (Next Day) Max : 4%
  4. Options Type: Weekly

Strategy Guideline:

  1. Options Strategy: Sell Call and Put
  2. Options Strike Price: Current Stock Price – (% Predicated Move x 2)
  3. Expiration Date: It should generally be the closest expiry immediately after the EA.
  4. Buy Insurance: Buying back Call and Put at Strike price which 10% lower than Sell Strike Price is optional but recommended.

Watch Video for More Detail

Volatility Rush Strategy - Best for Options Traders

The Volatility Rush takes advantage of increasing options premiums into earnings announcements (EA) caused by an anticipated rise in Implied Volatility (IV). With this strategy, Buy a Call and Put at-the-money (a long straddle) 2-3 weeks before the EA when IV is lower. Sell the position either (1) the night before the EA when the company announces earnings pre-market, or (2) during the EA day when it announces post-market, generally capturing IV at or close to its peak.

This popular screen will give you a list of stocks whose Options premiums tend to rise into Earnings. It includes only those stocks whose Earnings are at least two weeks away from today.

Screen criteria:

  1. Earnings Date Start Date : Current Date + 15 Days
  2. Earnings Date End Date : Current Date + 30 Days
  3. Predicted Move (Next Day) Min : 5%
  4. Options Type: Weekly or Monthly if that lines up with the two to three-week lead-time for entering the trade

Strategy Guideline:

  1. Buy a Straddle at or close to the money two to three weeks pre-EA.
  2. Sell the position either the night before the EA when the company announces earnings pre-market, or during the EA day when it announces post-market.
  3. Expiration date should generally be the closest expiry immediately after the EA.
  4. Straddle price should not be more 60% of predicted move.

Predicted Move (Volatility)

Similar to Implied Volatility in Options. Expected volatility % based on our Proprietary Volatility Predication Model. We are expecting that stock price will likely to reach % in either direction by the end of next trading session after Earnings are released and not necessarily the closing volatility %.

Why is it important?

    This indicator helps

  1. Knowing expected volatility in stocks after Earnings helps to decide trading stocks before Earnings Announcement.
  2. Taking Advantage of volatility collapse following Earnings Results by using Advance Options strategies such as Spread and Straddles.

Since Last Earnings

Change in share price since last Earnings release.

Why is it Important?

When share has gained more than 10% since it's last Earning release, it tends to over react to minor bad news and give up some gains if not all. So, it contains more downside volatility than upside When share has dropped more than 10% since it's last Earning release, it tends to over react to minor good news and recover some drops if not all. So, it contains more upside volatility than downside.

EPS Surprise (%)

Occurs when a company's reported quarterly or annual profits are above or below analysts' expectations. Here is the formula to derive % EPS Surprice:

Actual EPS - Estimated EPS
------------------------------------- x 100
Estimated EPS

Why is it Important?

Earnings surprises can have a huge impact on a company's stock price. Several studies suggest that positive earnings surprises not only lead to an immediate hike in a stock's price, but also to a gradual increase over time. Hence, it's not surprising that some companies are known for routinely beating earning projections. A negative earnings surprise will usually result in a decline in share price.

Next Day Price Change (%)

Next Regular trading session Closing price following Earnings result.

For After Market Close Earnings, It is a next trading day closing price. For Before Market Open Earnings, It is the same trading day closing price.

Why is it Important?

Next Day price change is a reaction of Earnings result.

How SpaceX Validated Nasdaq’s Decade-Long Bet

Posted on Jul 28, 2026 by Grayson Cavern

How SpaceX Validated Nasdaq’s Decade-Long Bet

Nasdaq Inc (NASDAQ: NDAQ) reported a record quarter 2 2026  earnings, with net revenue rising 15% year over year to $1.5 billion, non-GAAP EPS increasing 25% to $1.07, and non-GAAP operating margin expanding two percentage points to 57%. Solutions revenue grew 17%, annual recurring revenue reached $3.3 billion with 12% organic growth, and every business delivered double-digit growth simultaneously. The quarter also included the largest IPO in exchange history as SpaceX raised $86 billion. 

The simplest explanation is that Nasdaq benefited from an extraordinary listing. Well, not entirely. No doubt SpaceX made this a landmark quarter, but it didn’t create Nasdaq’s growth story. It exposed how far the company had already progressed in transforming itself from a traditional exchange into a technology platform that monetizes nearly every stage of the capital markets ecosystem. The IPO wasn’t the strategy. It became the clearest proof that the strategy was already working.

One IPO Powered Every Revenue Engine


SpaceX’s $86 billion IPO ran through almost every corner of Nasdaq’s business. Index revenue climbed 38% to $271 million as ETP assets linked to Nasdaq indices surpassed $1 trillion, supported by $109 billion in trailing 12-month net inflows. Market Services generated a record $340 million in net revenue, with Nasdaq’s Closing Cross executing $334 billion during the Russell reconstitution and another $296 billion during June’s Triple Witch session. U.S. index options volume reached a record average daily volume of 111,000 contracts, up 76% year over year. The quarter looked like a business firing on every cylinder because it was.

But one number changes everything. Index options revenue has now more than doubled year over year for four consecutive quarters. That trend began long before SpaceX listed. The IPO accelerated activity, but it didn’t create it. Investors were already using Nasdaq’s indices as the preferred way to express views on market volatility, and the exchange had already built the infrastructure to capture that shift.

That’s why I don’t see this as a one-off IPO quarter. SpaceX became the largest proof point in a strategy that was already producing results before the listing ever arrived.

A Decade Of Investment Paid Off

Nasdaq has spent the past decade building a business that investors still struggle to value correctly. Verafin expanded with 47 new SMB clients and six enterprise wins while its Agentic AI Workforce reached 750 clients. Financial Technology grew 15% organically, lifting ARR to $1.87 billion. Regulatory Technology added nine new clients, including its first AI-powered Calibration Copilot deployment with a Tier 1 institution, while Calypso continued expanding its global footprint across more than 70 countries.

None of those businesses needed SpaceX to justify their growth. They were already compounding at double-digit rates before the largest IPO in exchange history arrived.

SpaceX didn’t transform Nasdaq’s business overnight. It validated a decade-long shift toward recurring, software-driven revenue that has steadily reduced the company’s dependence on transaction activity. The listing became the moment the market could finally see every part of that strategy working at the same time.

Capital Allocation Reinforced The Outlook

Management didn’t pretend this quarter was perfect. Index revenue benefited from a $6 million contract modification, while Capital Markets Technology faces tougher comparisons after last year’s Calypso revenue. The company also expects a roughly $9 million annual headwind from delistings and raised non-GAAP expense guidance to $2.53-$2.57 billion as compensation and marketing spending increase alongside a strengthening IPO pipeline.

None of that changes the broader picture.

If management believed the current environment was temporary, it wouldn’t have authorized a $200-$250 million accelerated share repurchase program immediately after the quarter. Buybacks don’t guarantee future returns, but they do reveal how management views the durability of the business. In this case, capital allocation tells the same story as the operating results: Nasdaq is investing for a market cycle it expects to continue, not one it believes is peaking

Institutions Started Pricing The Shift

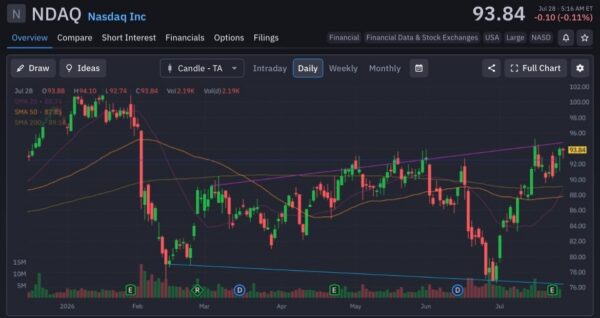
Nasdaq has quietly recovered from its April lows, reclaimed its 20-day, 50-day and 200-day moving averages, and is now testing the resistance zone around $94. More importantly, buying volume has expanded on advances while fading on pullbacks, a classic sign of institutional accumulation rather than short-covering.

That lines up with the fundamentals. Investors didn’t wait for SpaceX’s IPO to start buying Nasdaq. The stock began turning higher as the IPO pipeline strengthened and the market started recognizing the earnings power of its recurring software business. This quarter simply gave that move fundamental confirmation.

A decisive break above recent highs would suggest the market is beginning to price Nasdaq as more than an exchange.
nasdaq-StockEarnings

SpaceX Validated The Strategy

History will probably remember this as the SpaceX quarter. I think that’s selling Nasdaq short.

The IPO wasn’t remarkable because of the listing fee it generated. It was remarkable because one event simultaneously validated Nasdaq’s exchange, index, trading and technology businesses. Few companies are positioned to capture value across the capital markets ecosystem the way Nasdaq now can.

That’s what this earnings report proved. SpaceX just happened to be the evidence.

Join over 1.2M+ investors/traders who receive daily and weekly notable earnings alerts with predicted move
