ajax loader

Loading...


Ride-the-Wave Strategy – Best for Stock Traders

Ride-the-Wave targets multi-day price momentum following a company’s earnings announcement (EA). With this strategy:

  1. Buy a stock one day post-EA if a stock reacts positively post-earnings:
    1. Near the close of trading the EA-day for a pre-market-EA
    2. Near the close of the following day for a post-market-EA
  2. Sell-to-close after 7-10 days, or possibly earlier if a desired price target is reached

Similarly,

  1. short a stock one day post-EA if a stock reacts negatively post-earnings:
    1. near the close of trading the EA-day for a premarket-EA
    2. near the close of the following day for a post-market-EA
  2. then buy-to-close after 7-10 days, or possibly earlier if a desired price target is reached

Important: Ride-the-Wave is predicated on significant price momentum triggered by an EA. The 7-10 day scenario is the maximum trade hold-time. If you see post EA-momentum is halted or reversed by a significant opposite move, re-evaluate your presence in the trade.

This popular StockEarnings screen below will give you a list of stocks that historically exhibit significant price momentum following an EA for the next seven days:

  1. Stocks exhibiting positive post-EA price moves are buy-candidates
  2. Stocks exhibiting negative post-EA price moves are sell/short-candidates

The screen includes those stocks whose Earnings just came out in last two days.

Screen criteria:

  1. Earnings Date Start Date : Current Date + -1 Day
  2. Earnings Date End Date : Current Date + -2 Days
  3. Predicted Move (Next Day) Max : 7%
  4. Predicted Move (On 7th Day) Min : 7%

Strategy Guideline:

  1. Buy the stock if stock has reacted positively. Short the stock if stock has reacted negatively (see above).
  2. Close the position in 7-10 days, or possibly earlier based on price move.

Volatility Crush Strategy - Best for Options Traders

The Volatility Crush strategy is used with stocks that typically experience relatively low-to-moderate price moves (≤4%) following their Earnings Announcements (EA). The basic trade idea is to sell put or call options right before the EA, collecting a credit when options premium is very high due to elevated implied volatility (IV). You then close the position right after the EA by buying the option back much cheaper due to the significant drop in IV that occurs after the mystery of the EA disappears. In assessing this trade, you need to do your homework to ensure you collect sufficient premium to make the trade worthwhile.

This trade is practical due to the low-to-moderate price-move after the EA, which generally won’t significantly affect the options price, unlike an “action” stock, which experience great price moves post-EA. With these symbols, if you’re on the right side of the price move, that’s a great thing. But if you’re on the wrong side of the move, not so great. Consequently, by minimizing the effect of the post-EA price move, you have a much better chance to profit from the reduction in IV without it being ruined by a violent price move.

For this trade, open the position either (1) the night before the EA when the company announces earnings or (2) during the EA day when it announces post-market, generally capturing IV at or close to its peak.

For this trade, open the position either (1) the night before the EA when the company announces earnings or (2) during the EA day when it announces post-market, generally capturing IV at or close to its peak.

This popular stockearnings screen will give you a list of stocks which do not react more than 4% fpost-EA. It includes only those stocks whose earnings are releasing next day.

Screen criteria:

  1. Earnings Date Start Date : Current Date + 1
  2. Earnings Date End Date : Current Date + 1
  3. Predicted Move (Next Day) Max : 4%
  4. Options Type: Weekly

Strategy Guideline:

  1. Options Strategy: Sell Call and Put
  2. Options Strike Price: Current Stock Price – (% Predicated Move x 2)
  3. Expiration Date: It should generally be the closest expiry immediately after the EA.
  4. Buy Insurance: Buying back Call and Put at Strike price which 10% lower than Sell Strike Price is optional but recommended.

Watch Video for More Detail

Volatility Rush Strategy - Best for Options Traders

The Volatility Rush takes advantage of increasing options premiums into earnings announcements (EA) caused by an anticipated rise in Implied Volatility (IV). With this strategy, Buy a Call and Put at-the-money (a long straddle) 2-3 weeks before the EA when IV is lower. Sell the position either (1) the night before the EA when the company announces earnings pre-market, or (2) during the EA day when it announces post-market, generally capturing IV at or close to its peak.

This popular screen will give you a list of stocks whose Options premiums tend to rise into Earnings. It includes only those stocks whose Earnings are at least two weeks away from today.

Screen criteria:

  1. Earnings Date Start Date : Current Date + 15 Days
  2. Earnings Date End Date : Current Date + 30 Days
  3. Predicted Move (Next Day) Min : 5%
  4. Options Type: Weekly or Monthly if that lines up with the two to three-week lead-time for entering the trade

Strategy Guideline:

  1. Buy a Straddle at or close to the money two to three weeks pre-EA.
  2. Sell the position either the night before the EA when the company announces earnings pre-market, or during the EA day when it announces post-market.
  3. Expiration date should generally be the closest expiry immediately after the EA.
  4. Straddle price should not be more 60% of predicted move.

Predicted Move (Volatility)

Similar to Implied Volatility in Options. Expected volatility % based on our Proprietary Volatility Predication Model. We are expecting that stock price will likely to reach % in either direction by the end of next trading session after Earnings are released and not necessarily the closing volatility %.

Why is it important?

    This indicator helps

  1. Knowing expected volatility in stocks after Earnings helps to decide trading stocks before Earnings Announcement.
  2. Taking Advantage of volatility collapse following Earnings Results by using Advance Options strategies such as Spread and Straddles.

Since Last Earnings

Change in share price since last Earnings release.

Why is it Important?

When share has gained more than 10% since it's last Earning release, it tends to over react to minor bad news and give up some gains if not all. So, it contains more downside volatility than upside When share has dropped more than 10% since it's last Earning release, it tends to over react to minor good news and recover some drops if not all. So, it contains more upside volatility than downside.

EPS Surprise (%)

Occurs when a company's reported quarterly or annual profits are above or below analysts' expectations. Here is the formula to derive % EPS Surprice:

Actual EPS - Estimated EPS
------------------------------------- x 100
Estimated EPS

Why is it Important?

Earnings surprises can have a huge impact on a company's stock price. Several studies suggest that positive earnings surprises not only lead to an immediate hike in a stock's price, but also to a gradual increase over time. Hence, it's not surprising that some companies are known for routinely beating earning projections. A negative earnings surprise will usually result in a decline in share price.

Next Day Price Change (%)

Next Regular trading session Closing price following Earnings result.

For After Market Close Earnings, It is a next trading day closing price. For Before Market Open Earnings, It is the same trading day closing price.

Why is it Important?

Next Day price change is a reaction of Earnings result.

Walmart Stock Looks Expensive, But Catalysts Justify a Buy

Posted on Jul 28, 2026 by Chris Markoch

Walmart Stock Looks Expensive, But Catalysts Justify a Buy

Walmart (NASDAQ: WMT) stock trades at a premium most retailers can only dream of. Shares command roughly 39 times trailing earnings and about 38 times forward estimates, well above the retailer’s historical range and far pricier than most consumer staples peers. That valuation alone gives investors pause, especially after Walmart’s stock retreated from its 52-week high near $137 to trade around $112 today.

But a rich multiple isn’t automatically a reason to sell. Walmart is building real competitive advantages that could justify paying up. Walmart+ membership income jumped 45.6% in the U.S. segment last quarter, a sign the loyalty program is gaining serious traction against Amazon Prime. The company’s “dark store” fulfillment network is delivering to nearly 36% of store-fulfilled orders in under three hours, with some markets seeing delivery windows compressed to under 30 minutes.

Q1 FY27 results showed the underlying business remains healthy. Total revenue climbed 7.3% to $177.8 billion. Adjusted EPS rose 8.2% to 66 cents. Global eCommerce sales grew 26%, now representing 23% of total net sales.

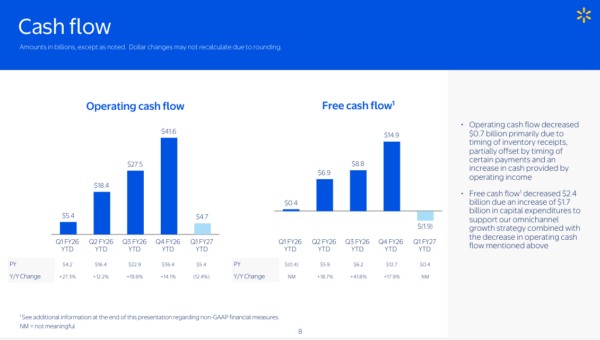
Yet one number stands out as a genuine concern: free cash flow turned negative $1.9 billion for the quarter, a $2.4 billion swing from the prior year. That gets at the heart of evaluating WMT stock right now. That is, are expanding growth engines enough to offset deteriorating near-term cash generation?
walmart - StockEarnings

Walmart+ And Dark Stores Are Reshaping The Growth Story


Walmart’s investment thesis increasingly hinges on services, not just merchandise. Walmart+ delivered record first-quarter net adds, and membership fee revenue climbed at a double-digit pace. That recurring, high-margin income stream mirrors what makes Amazon Prime so valuable to its parent company.

The dark store strategy compounds that advantage. By converting portions of existing stores into micro-fulfillment hubs, Walmart is using its 4,600-plus U.S. footprint as a logistics network Amazon (NASDAQ: AMZN) can’t easily replicate. Store-fulfilled delivery grew approximately 45% last quarter. Expedited deliveries under three hours made up roughly 36% of those orders.

This matters because speed drives frequency. Faster delivery windows encourage customers to treat Walmart as a daily-use app rather than an occasional destination. Advertising revenue is also benefiting, with Walmart Connect up 44% as more digital engagement creates monetizable ad inventory. Together, these pieces support a bull case for durable margin expansion, even if the stock already prices in some of that optimism.

Strong Comp Sales Show Momentum Across Every Segment

Walmart’s core retail engine hasn’t skipped a beat. U.S. comp sales rose 4.1%, driven by accelerated transactions and broad-based share gains across income tiers. Sam’s Club posted even stronger comp growth of 5.9%, fueled by 6.2% transaction growth.

International net sales climbed 10.1% in constant currency, with China posting 22.3% growth and Flipkart contributing to operating income gains. General merchandise saw its strongest share gains in five years.

That breadth matters. It’s not one segment carrying the company. Grocery, general merchandise, international, and membership income are all contributing, which reduces the risk that a single soft category could derail guidance. Management’s Q2 FY27 outlook calls for adjusted EPS of 72 cents to 74 cents, implying continued double-digit growth versus last year’s comparable quarter.

Technical Picture Reflects The Valuation Debate

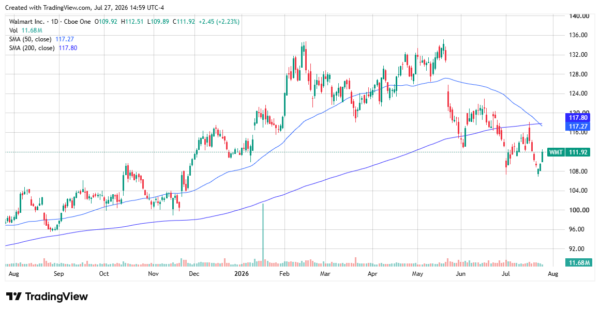
WMT’s chart tells the same story as its fundamentals: a name searching for direction. Shares surged from around $104 in November to a peak near $137 by April, then reversed sharply, falling below both the 50-day ($117.27) and 200-day ($117.80) moving averages.

The stock now sits around $112, roughly 5% below its 200-day average. That’s a bearish signal technically, though today’s 2.2% bounce suggests buyers are stepping in near current levels. A close back above the 50-day average would signal the correction may be ending. Until then, the technical setup favors caution.
walmart - StockEarnings

Priced For Perfection, But Perfection May Be Coming

Walmart isn’t cheap by any conventional measure. At 38 times forward earnings, the stock demands flawless execution. The negative free cash flow quarter adds a legitimate reason for skepticism, driven largely by a $1.7 billion jump in capital expenditures supporting the omnichannel buildout.

But that capex is buying something valuable: a delivery network and membership ecosystem that could widen Walmart’s moat for years. Investors willing to look past one messy cash flow quarter may find a company still executing well ahead of a valuation that already assumes it will.

For those comfortable paying up for quality, Walmart’s catalysts heading into earnings make a compelling case that expensive doesn’t have to mean overvalued.


A former marketing copywriter turned freelance financial writer and market analyst. I have a passion for delivering insights to investors. I write regularly about stocks for StockEarnings and MarketBeat. Posts are not advice.

Join over 1.2M+ investors/traders who receive daily and weekly notable earnings alerts with predicted move