ajax loader

Loading...


Ride-the-Wave Strategy – Best for Stock Traders

Ride-the-Wave targets multi-day price momentum following a company’s earnings announcement (EA). With this strategy:

  1. Buy a stock one day post-EA if a stock reacts positively post-earnings:
    1. Near the close of trading the EA-day for a pre-market-EA
    2. Near the close of the following day for a post-market-EA
  2. Sell-to-close after 7-10 days, or possibly earlier if a desired price target is reached

Similarly,

  1. short a stock one day post-EA if a stock reacts negatively post-earnings:
    1. near the close of trading the EA-day for a premarket-EA
    2. near the close of the following day for a post-market-EA
  2. then buy-to-close after 7-10 days, or possibly earlier if a desired price target is reached

Important: Ride-the-Wave is predicated on significant price momentum triggered by an EA. The 7-10 day scenario is the maximum trade hold-time. If you see post EA-momentum is halted or reversed by a significant opposite move, re-evaluate your presence in the trade.

This popular StockEarnings screen below will give you a list of stocks that historically exhibit significant price momentum following an EA for the next seven days:

  1. Stocks exhibiting positive post-EA price moves are buy-candidates
  2. Stocks exhibiting negative post-EA price moves are sell/short-candidates

The screen includes those stocks whose Earnings just came out in last two days.

Screen criteria:

  1. Earnings Date Start Date : Current Date + -1 Day
  2. Earnings Date End Date : Current Date + -2 Days
  3. Predicted Move (Next Day) Max : 7%
  4. Predicted Move (On 7th Day) Min : 7%

Strategy Guideline:

  1. Buy the stock if stock has reacted positively. Short the stock if stock has reacted negatively (see above).
  2. Close the position in 7-10 days, or possibly earlier based on price move.

Volatility Crush Strategy - Best for Options Traders

The Volatility Crush strategy is used with stocks that typically experience relatively low-to-moderate price moves (≤4%) following their Earnings Announcements (EA). The basic trade idea is to sell put or call options right before the EA, collecting a credit when options premium is very high due to elevated implied volatility (IV). You then close the position right after the EA by buying the option back much cheaper due to the significant drop in IV that occurs after the mystery of the EA disappears. In assessing this trade, you need to do your homework to ensure you collect sufficient premium to make the trade worthwhile.

This trade is practical due to the low-to-moderate price-move after the EA, which generally won’t significantly affect the options price, unlike an “action” stock, which experience great price moves post-EA. With these symbols, if you’re on the right side of the price move, that’s a great thing. But if you’re on the wrong side of the move, not so great. Consequently, by minimizing the effect of the post-EA price move, you have a much better chance to profit from the reduction in IV without it being ruined by a violent price move.

For this trade, open the position either (1) the night before the EA when the company announces earnings or (2) during the EA day when it announces post-market, generally capturing IV at or close to its peak.

For this trade, open the position either (1) the night before the EA when the company announces earnings or (2) during the EA day when it announces post-market, generally capturing IV at or close to its peak.

This popular stockearnings screen will give you a list of stocks which do not react more than 4% fpost-EA. It includes only those stocks whose earnings are releasing next day.

Screen criteria:

  1. Earnings Date Start Date : Current Date + 1
  2. Earnings Date End Date : Current Date + 1
  3. Predicted Move (Next Day) Max : 4%
  4. Options Type: Weekly

Strategy Guideline:

  1. Options Strategy: Sell Call and Put
  2. Options Strike Price: Current Stock Price – (% Predicated Move x 2)
  3. Expiration Date: It should generally be the closest expiry immediately after the EA.
  4. Buy Insurance: Buying back Call and Put at Strike price which 10% lower than Sell Strike Price is optional but recommended.

Watch Video for More Detail

Volatility Rush Strategy - Best for Options Traders

The Volatility Rush takes advantage of increasing options premiums into earnings announcements (EA) caused by an anticipated rise in Implied Volatility (IV). With this strategy, Buy a Call and Put at-the-money (a long straddle) 2-3 weeks before the EA when IV is lower. Sell the position either (1) the night before the EA when the company announces earnings pre-market, or (2) during the EA day when it announces post-market, generally capturing IV at or close to its peak.

This popular screen will give you a list of stocks whose Options premiums tend to rise into Earnings. It includes only those stocks whose Earnings are at least two weeks away from today.

Screen criteria:

  1. Earnings Date Start Date : Current Date + 15 Days
  2. Earnings Date End Date : Current Date + 30 Days
  3. Predicted Move (Next Day) Min : 5%
  4. Options Type: Weekly or Monthly if that lines up with the two to three-week lead-time for entering the trade

Strategy Guideline:

  1. Buy a Straddle at or close to the money two to three weeks pre-EA.
  2. Sell the position either the night before the EA when the company announces earnings pre-market, or during the EA day when it announces post-market.
  3. Expiration date should generally be the closest expiry immediately after the EA.
  4. Straddle price should not be more 60% of predicted move.

Predicted Move (Volatility)

Similar to Implied Volatility in Options. Expected volatility % based on our Proprietary Volatility Predication Model. We are expecting that stock price will likely to reach % in either direction by the end of next trading session after Earnings are released and not necessarily the closing volatility %.

Why is it important?

    This indicator helps

  1. Knowing expected volatility in stocks after Earnings helps to decide trading stocks before Earnings Announcement.
  2. Taking Advantage of volatility collapse following Earnings Results by using Advance Options strategies such as Spread and Straddles.

Since Last Earnings

Change in share price since last Earnings release.

Why is it Important?

When share has gained more than 10% since it's last Earning release, it tends to over react to minor bad news and give up some gains if not all. So, it contains more downside volatility than upside When share has dropped more than 10% since it's last Earning release, it tends to over react to minor good news and recover some drops if not all. So, it contains more upside volatility than downside.

EPS Surprise (%)

Occurs when a company's reported quarterly or annual profits are above or below analysts' expectations. Here is the formula to derive % EPS Surprice:

Actual EPS - Estimated EPS
------------------------------------- x 100
Estimated EPS

Why is it Important?

Earnings surprises can have a huge impact on a company's stock price. Several studies suggest that positive earnings surprises not only lead to an immediate hike in a stock's price, but also to a gradual increase over time. Hence, it's not surprising that some companies are known for routinely beating earning projections. A negative earnings surprise will usually result in a decline in share price.

Next Day Price Change (%)

Next Regular trading session Closing price following Earnings result.

For After Market Close Earnings, It is a next trading day closing price. For Before Market Open Earnings, It is the same trading day closing price.

Why is it Important?

Next Day price change is a reaction of Earnings result.

Despite Disney’s Downturn, Here’s Why Contrarianism Requires Caution

Posted on Jul 09, 2026 by Joshua Enomoto

Despite Disney’s Downturn, Here’s Why Contrarianism Requires Caution

It’s an understandable thesis. With Disney (NYSE: DIS) suffering a disappointing performance this year, shedding more than 14% of market value since the January opener, it’s reasonable to assume that mean reversion could send DIS stock higher. After all, the equities market is a reactive system, responding in a dynamic manner to acute pressure.

In fact, the concept that public securities respond differently to specific triggers is the basic foundation of my higher-order Markov simulations. Under standard trading frameworks like Black-Scholes, risk is defined as the distance (in terms of standard deviations) between the spot price of an asset and the target threshold, assuming a log-normal distribution.

However, I have consistently refuted the idea that market distributions can be assumed to be log-normal. Even if they were, I especially find it erroneous that log-normal functions would apply irrespective of the security’s sentiment state, whether bullish, bearish or consolidatory. Despite this, with DIS stock suffering a prolonged downturn — such as a 52-week loss of nearly 20% — a common conclusion is that the selloff may be overdone.

We’re talking about Disney. Yes, the company has suffered some missteps, including embroiling itself in political and ideological controversies. Nevertheless, it’s still a media and entertainment powerhouse, commanding incredibly desirous brands and content franchises. That’s got to be worth something; hence, the belief that DIS stock can rebound higher.

While the theory makes sense, mean reversion can’t be assumed wholesale. It’s one of the criticisms/concerns that I have about how technical analysis is commonly practiced in the financial publication ecosystem. Just because it’s asserted that, say, the cup-and-handle formation probabilistically leads to a bullish outcome doesn’t mean the argument is valid.

You have to check for the security at hand. It’s very possible that certain names may respond differently to established technical patterns. So it is with DIS stock. Let’s not assume that it’s going to automatically mean revert because it’s suffering a bearish cycle.

Instead, we should verify the implications from the data.

Laying Out the Conditional Inference of DIS Stock


Now, I don’t think it’s a controversial point to discuss the psychological market dynamics surrounding a contrarian bullish position in Disney stock. Primarily, the observation is that securities suffering a bearish cycle practically never fall in a smooth, linear fashion. Instead, even the most pronounced downturns are met with reactionary upswings.

What’s the reason for these countermoves? Basically, human market participants do not have infinite risk tolerance. During an extended downturn, the weak hands holding a security may be systematically shaken out through trailing stop-losses, margin call liquidations and pure psychological capitulation. When that happens, the bears suffer an exhaustive phase, opening the door for the contrarian bulls to shoot the security above weakened resistance levels.

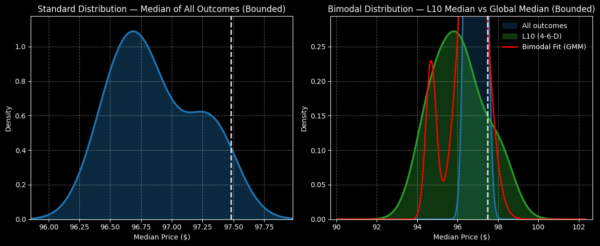
As sensible as this assumption is, the data at this point doesn’t support a contrarian position in DIS stock. In the last 10 weeks, Disney printed four up weeks, leading to a downward slope across the period. Since January 2019, this 4-6-D sequence has materialized 47 times on a rolling basis.

If this bearish sequence consistently led to positive mean reversion, we would expect the median distribution of outcomes to beat the random baseline (that is, the net return of buying DIS stock randomly). Unfortunately, that’s not what the data shows. Conditioned for the aforementioned signal, Disney’s expected forward 10-week distribution would land between $92 and $100, with probability density peaking just shy of $96.
disney-StockEarnings

What’s the problem with this range? It assumes a starting price of $97.48, Tuesday’s close. If over the next 10 weeks, the median representative price across the spectrum is $96, you’re talking about a negative exceedance ratio.

Technically speaking, you’re actually better off buying DIS stock randomly, which since January 2019 has not been an effective solution. If you just bought Disney stock with no regard as to waiting for a specific signal, your forward 10-week distribution would likely land between $96 and $98, with probability density peaking at $96.70.

In both cases, the frequentist argument would likely see your head underwater.

A Nuance to Consider

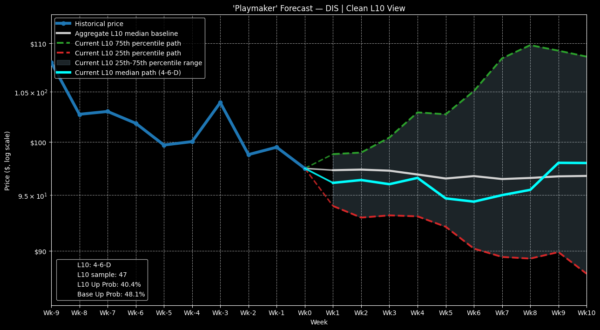
To be honest, the bullish contrarian case for Disney stock isn’t completely dead. Under the 4-6-D sequence, the 75th percentile pathway shows potential for DIS hitting $110 (around week 8 of the forward 10-week distribution). Further, the 25th percentile pathway is asymmetrically mitigated on a relative basis, dropping to around $89 at week 8.

Of course, the problem is that neither the 75th nor 25th percentile pathways are likely; they merely represent what could happen during outlier cycles. That’s not to discourage you from considering the bullish case, per se. However, you really need to consider the frequency risk.

Basically, if you ran this trade across a hundred parallel universes, you would likely lose at least 60 times. Obviously, that’s not an edge for the bulls. However, it could be an idea for near-term bearish speculators to consider.
disney-StockEarnings

According to an inductive calculation of DIS stock under 4-6-D conditions, the median price of shares has demonstrated a tendency of sagging between weeks 5 and 7. If the pattern holds true this time around, we may expect DIS to linger at around $95 before marching higher in week 8 and beyond.

Should you believe in the pattern recognition, the empirically sensible idea is to consider the 100/95 bear put spread expiring Aug. 21. Should DIS stock fall through the $95 strike at expiration, the maximum payout stands at over 85%. The net debit per spread comes out to $270, with the breakeven price clocking in at $97.30.

What makes this trade tick for me is that the market is assigning a probability of only 49.4% that Disney stock will fall to the breakeven price. Again, this probability assumes a log-normal, risk-neutral distribution, which I disagree with. Instead, I believe acute pressures cause acute responses. While it’s incredibly difficult to provide a hard answer, I’d estimate that the “real” probability is between 55% to 60%.

Frankly, I don’t think the mispricing is wide enough to justify much excitement. However, I do believe that in the near term, the bears may have more influence on DIS stock than the bulls.


Joshua Enomoto is a seasoned financial writer with a strong track record of in-depth stock analysis, offering clear, insightful commentary for retail investors across all levels of expertise. Renowned for his ability to blend analytical rigor with engaging wit, Joshua's work has been featured on leading investment platforms, including TipRanks, InvestorPlace, Barchart, Benzinga, and Fintel. He was also handpicked to spearhead high-impact initiatives such as InvestorPlace's "Trade of the Day" and Benzinga’s ETF coverage. As a frequent guest expert for CGTN America, Joshua discusses a wide range of economic, societal, and consumer market trends. A graduate of U.C. San Diego, Joshua brings a thoughtful and fresh perspective to complex financial narratives, helping enterprise clients connect with their audiences. He also composes music in his spare time.

Join over 1.2M+ investors/traders who receive daily and weekly notable earnings alerts with predicted move