ajax loader

Loading...


Ride-the-Wave Strategy – Best for Stock Traders

Ride-the-Wave targets multi-day price momentum following a company’s earnings announcement (EA). With this strategy:

  1. Buy a stock one day post-EA if a stock reacts positively post-earnings:
    1. Near the close of trading the EA-day for a pre-market-EA
    2. Near the close of the following day for a post-market-EA
  2. Sell-to-close after 7-10 days, or possibly earlier if a desired price target is reached

Similarly,

  1. short a stock one day post-EA if a stock reacts negatively post-earnings:
    1. near the close of trading the EA-day for a premarket-EA
    2. near the close of the following day for a post-market-EA
  2. then buy-to-close after 7-10 days, or possibly earlier if a desired price target is reached

Important: Ride-the-Wave is predicated on significant price momentum triggered by an EA. The 7-10 day scenario is the maximum trade hold-time. If you see post EA-momentum is halted or reversed by a significant opposite move, re-evaluate your presence in the trade.

This popular StockEarnings screen below will give you a list of stocks that historically exhibit significant price momentum following an EA for the next seven days:

  1. Stocks exhibiting positive post-EA price moves are buy-candidates
  2. Stocks exhibiting negative post-EA price moves are sell/short-candidates

The screen includes those stocks whose Earnings just came out in last two days.

Screen criteria:

  1. Earnings Date Start Date : Current Date + -1 Day
  2. Earnings Date End Date : Current Date + -2 Days
  3. Predicted Move (Next Day) Max : 7%
  4. Predicted Move (On 7th Day) Min : 7%

Strategy Guideline:

  1. Buy the stock if stock has reacted positively. Short the stock if stock has reacted negatively (see above).
  2. Close the position in 7-10 days, or possibly earlier based on price move.

Volatility Crush Strategy - Best for Options Traders

The Volatility Crush strategy is used with stocks that typically experience relatively low-to-moderate price moves (≤4%) following their Earnings Announcements (EA). The basic trade idea is to sell put or call options right before the EA, collecting a credit when options premium is very high due to elevated implied volatility (IV). You then close the position right after the EA by buying the option back much cheaper due to the significant drop in IV that occurs after the mystery of the EA disappears. In assessing this trade, you need to do your homework to ensure you collect sufficient premium to make the trade worthwhile.

This trade is practical due to the low-to-moderate price-move after the EA, which generally won’t significantly affect the options price, unlike an “action” stock, which experience great price moves post-EA. With these symbols, if you’re on the right side of the price move, that’s a great thing. But if you’re on the wrong side of the move, not so great. Consequently, by minimizing the effect of the post-EA price move, you have a much better chance to profit from the reduction in IV without it being ruined by a violent price move.

For this trade, open the position either (1) the night before the EA when the company announces earnings or (2) during the EA day when it announces post-market, generally capturing IV at or close to its peak.

For this trade, open the position either (1) the night before the EA when the company announces earnings or (2) during the EA day when it announces post-market, generally capturing IV at or close to its peak.

This popular stockearnings screen will give you a list of stocks which do not react more than 4% fpost-EA. It includes only those stocks whose earnings are releasing next day.

Screen criteria:

  1. Earnings Date Start Date : Current Date + 1
  2. Earnings Date End Date : Current Date + 1
  3. Predicted Move (Next Day) Max : 4%
  4. Options Type: Weekly

Strategy Guideline:

  1. Options Strategy: Sell Call and Put
  2. Options Strike Price: Current Stock Price – (% Predicated Move x 2)
  3. Expiration Date: It should generally be the closest expiry immediately after the EA.
  4. Buy Insurance: Buying back Call and Put at Strike price which 10% lower than Sell Strike Price is optional but recommended.

Watch Video for More Detail

Volatility Rush Strategy - Best for Options Traders

The Volatility Rush takes advantage of increasing options premiums into earnings announcements (EA) caused by an anticipated rise in Implied Volatility (IV). With this strategy, Buy a Call and Put at-the-money (a long straddle) 2-3 weeks before the EA when IV is lower. Sell the position either (1) the night before the EA when the company announces earnings pre-market, or (2) during the EA day when it announces post-market, generally capturing IV at or close to its peak.

This popular screen will give you a list of stocks whose Options premiums tend to rise into Earnings. It includes only those stocks whose Earnings are at least two weeks away from today.

Screen criteria:

  1. Earnings Date Start Date : Current Date + 15 Days
  2. Earnings Date End Date : Current Date + 30 Days
  3. Predicted Move (Next Day) Min : 5%
  4. Options Type: Weekly or Monthly if that lines up with the two to three-week lead-time for entering the trade

Strategy Guideline:

  1. Buy a Straddle at or close to the money two to three weeks pre-EA.
  2. Sell the position either the night before the EA when the company announces earnings pre-market, or during the EA day when it announces post-market.
  3. Expiration date should generally be the closest expiry immediately after the EA.
  4. Straddle price should not be more 60% of predicted move.

Predicted Move (Volatility)

Similar to Implied Volatility in Options. Expected volatility % based on our Proprietary Volatility Predication Model. We are expecting that stock price will likely to reach % in either direction by the end of next trading session after Earnings are released and not necessarily the closing volatility %.

Why is it important?

    This indicator helps

  1. Knowing expected volatility in stocks after Earnings helps to decide trading stocks before Earnings Announcement.
  2. Taking Advantage of volatility collapse following Earnings Results by using Advance Options strategies such as Spread and Straddles.

Since Last Earnings

Change in share price since last Earnings release.

Why is it Important?

When share has gained more than 10% since it's last Earning release, it tends to over react to minor bad news and give up some gains if not all. So, it contains more downside volatility than upside When share has dropped more than 10% since it's last Earning release, it tends to over react to minor good news and recover some drops if not all. So, it contains more upside volatility than downside.

EPS Surprise (%)

Occurs when a company's reported quarterly or annual profits are above or below analysts' expectations. Here is the formula to derive % EPS Surprice:

Actual EPS - Estimated EPS
------------------------------------- x 100
Estimated EPS

Why is it Important?

Earnings surprises can have a huge impact on a company's stock price. Several studies suggest that positive earnings surprises not only lead to an immediate hike in a stock's price, but also to a gradual increase over time. Hence, it's not surprising that some companies are known for routinely beating earning projections. A negative earnings surprise will usually result in a decline in share price.

Next Day Price Change (%)

Next Regular trading session Closing price following Earnings result.

For After Market Close Earnings, It is a next trading day closing price. For Before Market Open Earnings, It is the same trading day closing price.

Why is it Important?

Next Day price change is a reaction of Earnings result.

Joby Aviation’s $2.2 Billion Cash Pile Is Funding a Race Against Time

Posted on Nov 06, 2026 by Grayson Cavern

Joby Aviation’s $2.2 Billion Cash Pile Is Funding a Race Against Time

Joby Aviation (NYSE: JOBY) has spent more than a decade developing an electric aircraft designed to turn urban air travel into a commercial business. Its latest Q3 earnings show a company making progress toward that ambition, backed by $2.2 billion in cash and short-term investments. Yet the distance between developing an aircraft and operating a profitable air-taxi service remains expensive.

Third-quarter revenue climbed 144% to $55.1 million, but the operating loss widened 53% to $278.1 million. Research and development expenses alone reached $208.6 million, up 40% year over year. 

The revenue growth looks impressive; its source, however, reveals why investors still need to be cautious about the economics of this business.

Blade Generates Revenue While Joby’s Aircraft Remains In Development


Joby’s passenger revenue reached $53.2 million during the quarter, while other revenue contributed just $1.9 million. Almost all passenger revenue came from Blade, the air charter platform Joby acquired in August 2025.

Blade gives Joby an operating presence in passenger transportation while its electric aircraft moves through certification. But its growth doesn’t demonstrate demand for the company’s own eVTOL aircraft. Investors looking at the 144% revenue increase should recognize that most of this business still comes from conventional aviation.

The cost structure adds another complication. The company’s cost of revenue increased 288% to $39 million, substantially faster than revenue. Joby also spent $208.6 million on research and development and $85.6 million on selling, general, and administrative expenses.

In other words, Blade is expanding the revenue base, but the aircraft development program continues consuming capital without generating commercial aircraft revenue. The company needs both operations to contribute economically. At present, one is still being built while the other carries much of the reported passenger business.

FAA Certification Is Advancing, But the Expensive Work Isn’t Finished

The strongest part of Joby’s investment case remains its progress toward FAA type certification. The company has completed or substantially completed three of the five certification stages, reports more than 80% completion in Stage 4, and says it is progressing through Stage 5. 

That progress gives Joby a meaningful position in the race to commercialize electric vertical takeoff and landing aircraft. The company also sees opportunities under the federal eVTOL Integration Pilot Program to begin initial flights in selected U.S. markets before full type certification.

Its government relationships offer another commercial avenue. In October, the company announced expanded U.S. Air Force contracts for autonomous flight technology, bringing the Air Force’s total commitment from $20 million to nearly $37 million.

However, certification progress and commercial approval are different milestones. Joby still needs the necessary production and operational authorizations. Regulatory changes or additional FAA requirements could delay its launch, extending the period in which development expenses arrive before meaningful aircraft revenue.

The $2.2 Billion Cushion Comes With a Dilution Trade-off

Joby ended September with $2.198 billion in cash, cash equivalents, and short-term investments. That provides substantial financial flexibility, but investors should examine how the company built that cushion.

During the first nine months of 2026, the company raised $576.3 million through a common stock offering, received $669.7 million from convertible notes, and generated another $128.2 million through its at-the-market offering. Its share count increased from approximately 915.1 million at the end of 2025 to 1.013 billion at September 30. 

Operating cash outflow reached $486.2 million over nine months, averaging approximately $162 million per quarter. That spending rate makes the cash balance look substantial, but it also shows how much capital the company consumes before its aircraft business reaches commercial scale.

Joby’s planned $500 million acquisition of Resonant Sciences adds another consideration. The transaction is expected to be paid primarily in cash, with approximately $50 million in stock. The company also has up to $49 million in remaining potential contributions to its U.S. vertiport infrastructure arrangement. 

The balance sheet provides room to execute, but its expanding commitments make capital allocation increasingly important. Investors are effectively funding several ambitions at once, from aircraft certification and manufacturing to infrastructure and defense technology.

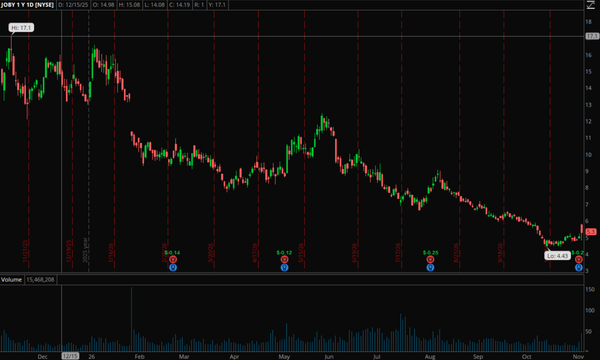
Buyers Need To Defend the $4.43 Low

JOBY shares have fallen from a chart high of $17.10 to $4.43, establishing a prolonged sequence of lower highs and lower lows. The recent recovery toward $5.30 has yet to change that structure. 

Speaking of volume, several of the largest trading spikes appeared during earlier declines, indicating heavy participation as shares sold off. More recently, trading activity has moderated as the stock approached its October low. That could signal selling pressure is easing, although declining volume alone doesn’t establish accumulation.

The $4.43 low is the immediate downside reference. Buyers need to defend that area and push through 5.50-6 to offer an early indication that demand is returning. The 7-8 region represents a more substantial overhead hurdle. A recovery accompanied by expanding volume would carry more conviction than a low-volume bounce.
joby - StockEarnings

More Execution Risk Than Commercial Proof

I’m leaning bearish on JOBY at its current stage. The $2.2 billion liquidity position and FAA certification progress make Joby a serious contender in the electric air-taxi market, but its financial performance hasn’t caught up with its ambitions. Blade supplies almost all passenger revenue, operating losses are widening, and the company continues raising capital to finance development and expansion.

That leaves shareholders exposed to certification delays, further dilution, and the possibility that commercial operations take longer or cost more to scale than management expects. The technology may eventually support a valuable aviation business, but the stock is still asking investors to pay for that outcome before the industry has demonstrated the economics. For now, the execution risk outweighs the commercial proof.


Join over 1.2M+ investors/traders who receive daily and weekly notable earnings alerts with predicted move