It’s not something that the mainstream financial media is talking about but something rare just flashed for Hilton Hotels (NYSE: HLT). While HLT stock has put on a relatively strong performance given the overall economic circumstances, its recent trend has been less than ideal. In the past month through Thursday’s close, for example, HLT slipped roughly 2%. What’s worse, the weekly technical chart shows a long string of negative sessions.
As a static picture, HLT doesn’t look particularly enticing. Sure, Hilton apologists might point out that the company delivered a solid second-quarter earnings report, per Google Finance’s summary sheet. But it’s also fair to mention that Hilton missed analysts’ consensus revenue target for Q2. In addition, HLT trades at an elevated earnings multiple relative to peers.
With that context in mind, Hilton stock hasn’t been devastating for recent holders but it hasn’t performed up to snuff. Making matters worse, the quantitative profile doesn’t seem attractive. Of the last 10 weekly sessions, only three of these weekly candlesticks were positive (where the closing price of the period was higher than the open).
Again, on the surface, this 3-7-D sequence (3 up, 7 down, downward slope) seems to be a deterrent to options traders looking for a confidence-inspiring name. However, it doesn’t really matter what the current status is. Rather, it’s what typically happens next that counts.
And that’s what makes discretizing price action into up and down weeks so interesting mathematically. We now have a quantifiable signal that we can reference from past data. Through this analysis, we can inductively infer how Hilton stock typically responds to the aforementioned signal.
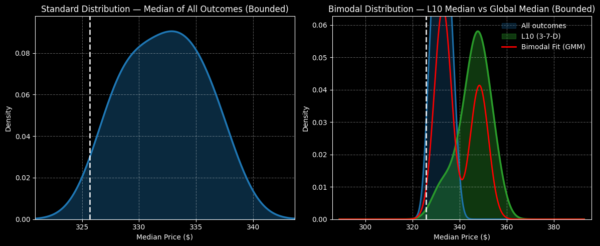
We’ll go into the math later but based on the evidence, there may be a rational case for HLT stock to reach $350 over the next six to seven weeks. If so, the 340/350 bull call spread expiring Oct. 16 should be on speculators’ radar.
Addressing the Random Walk Assumption of HLT Stock
If indeed Hilton stock does hit $350 on Oct. 16, the reward could be enormous. For a net debit (cash outlay) of $390, should HLT trigger the second-leg strike price, the maximum profit would come out to $610, a payout of over 156%. But before you do your happy dance, you must keep this in mind: the odds of success are extremely limited.
Take for example the 340/350 bull spread’s breakeven price of $343.90. At time of writing, HLT stock must rise 5.59% to trigger the threshold. However, the implied volatility (IV) of the October monthly options chain is quite low at 24.41%, with the historic volatility sitting at 23.80%. As such, HLT theoretically doesn’t have enough “fuel” to convincingly break even.
In statistical terms, Wall Street’s Black-Scholes options-pricing mechanism states that the odds of HLT stock reaching $343.90 are only 27.3%. If that wasn’t bad enough, OptionCharts Probability Distribution screener reports that the chance of the ticker hitting the $350 strike is only 21.64%.
Obviously, if you were to run a theoretical expected value (EV) calculation, executing this exact same trade across multiple parallel universes would lead you deeply in the red. While you may be winning $610, that win ratio would only occur less than 22% of the time. Therefore, in the other 78% of the time, you would be losing $390. The losses would soon outpace the wins, leading to a negative EV.
In a way, the low probabilities represent the Street providing a massive caveat against buying this Hilton stock call spread. But you should also note that the options pricing mechanism may be flawed.
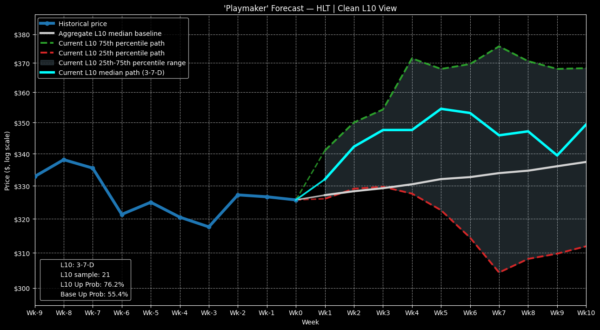
How can I make such an audacious statement? It’s because the underlying assumption of Black-Scholes is geometric Brownian motion. Stated differently, the model is assuming that HLT stock will undergo a random walk between now and the expiration date, with a constant IV of 24.41% throughout the journey.
I simply don’t find this randomness to be plausible. Instead, the aforementioned quant signal implies that the near-term trajectory of HLT stock should be nonrandom.
A Nonrandom Walk for Hilton Stock Makes More Sense
It may seem self-serving but as an industry, we financial analysts all believe in nonrandom price discovery. Look at the articles that the financial publication sector produces on the daily: “This Stock May Have Just Bottomed Out” or “3 Stocks to Buy for the Santa Claus Rally”. If we believed that equities would undergo Brownian motion, we would simply write articles saying, “This Stock is About to Take a Random Walk.”
Honestly, who the heck is going to read an article like that? I think I’m in the clear to say absolutely no one. And that’s the point of financial content. Somebody has found something, an undervalued metric in the financials, a technical pattern in the charts, a business model that few are currently paying attention to. It’s this “something” that the author believes will drive nonrandom (and therefore exploitable) behavior.
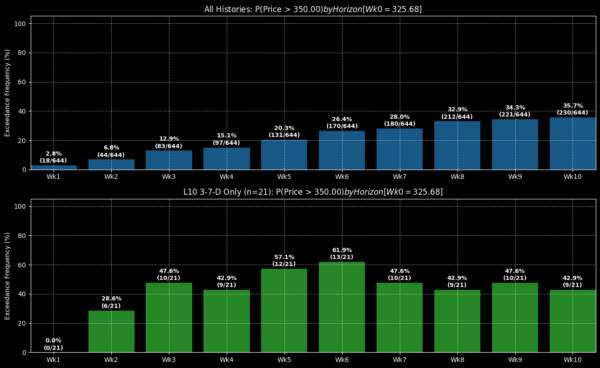
My nonrandom “something” is the 3-7-D sequence that HLT stock just flashed. Since Hilton’s initial public offering, this signal has materialized 21 times on a rolling basis. Of this figure, HLT has exceeded the equivalent of the $350 second-leg strike a total of 13 times on week 6 and 10 times on week 7. For the Oct. 16 expiration date, that would put the conditioned probability of full probability between 47.6% and 61.9%.
Granted, we’re talking about a very small sample size. However, in this case, it might be somewhat forgiven because the dataset goes back to Hilton’s IPO. While I can’t say there’s absolute strong confidence in the analysis, it’s of a higher confidence than other analyses because we’re covering a much wider distribution. Since Hilton’s lodging business shouldn’t materially change across eras — unlike tech — the data expansion is possible.
A Final Caveat to Consider
It’s important to realize that inductive models like the one above are not foolproof; far from it. I’ve had my fair share of misses. But the point of the analysis is to use empirical data to help pinpoint a likely outcome while also helping readers take smarter risks. Of course, the risk itself can never be eliminated and that’s especially the case for options trading.
Still, as a final defense, I would argue this. According to Wall Street’s presupposition (which I believe is flawed due to random walk assumptions), the Oct. 16 340/350 bull call spread would be a non-starter. However, with a more reasonable, nonrandom presupposition, the odds of success may be better than advertised.
It doesn’t mean that HLT stock is a no-brainer because you’re still absorbing risks no matter what. But with a more realistic model or framework, that risk could be less than what is commonly advertised.

