ajax loader

Loading...


Ride-the-Wave Strategy – Best for Stock Traders

Ride-the-Wave targets multi-day price momentum following a company’s earnings announcement (EA). With this strategy:

  1. Buy a stock one day post-EA if a stock reacts positively post-earnings:
    1. Near the close of trading the EA-day for a pre-market-EA
    2. Near the close of the following day for a post-market-EA
  2. Sell-to-close after 7-10 days, or possibly earlier if a desired price target is reached

Similarly,

  1. short a stock one day post-EA if a stock reacts negatively post-earnings:
    1. near the close of trading the EA-day for a premarket-EA
    2. near the close of the following day for a post-market-EA
  2. then buy-to-close after 7-10 days, or possibly earlier if a desired price target is reached

Important: Ride-the-Wave is predicated on significant price momentum triggered by an EA. The 7-10 day scenario is the maximum trade hold-time. If you see post EA-momentum is halted or reversed by a significant opposite move, re-evaluate your presence in the trade.

This popular StockEarnings screen below will give you a list of stocks that historically exhibit significant price momentum following an EA for the next seven days:

  1. Stocks exhibiting positive post-EA price moves are buy-candidates
  2. Stocks exhibiting negative post-EA price moves are sell/short-candidates

The screen includes those stocks whose Earnings just came out in last two days.

Screen criteria:

  1. Earnings Date Start Date : Current Date + -1 Day
  2. Earnings Date End Date : Current Date + -2 Days
  3. Predicted Move (Next Day) Max : 7%
  4. Predicted Move (On 7th Day) Min : 7%

Strategy Guideline:

  1. Buy the stock if stock has reacted positively. Short the stock if stock has reacted negatively (see above).
  2. Close the position in 7-10 days, or possibly earlier based on price move.

Volatility Crush Strategy - Best for Options Traders

The Volatility Crush strategy is used with stocks that typically experience relatively low-to-moderate price moves (≤4%) following their Earnings Announcements (EA). The basic trade idea is to sell put or call options right before the EA, collecting a credit when options premium is very high due to elevated implied volatility (IV). You then close the position right after the EA by buying the option back much cheaper due to the significant drop in IV that occurs after the mystery of the EA disappears. In assessing this trade, you need to do your homework to ensure you collect sufficient premium to make the trade worthwhile.

This trade is practical due to the low-to-moderate price-move after the EA, which generally won’t significantly affect the options price, unlike an “action” stock, which experience great price moves post-EA. With these symbols, if you’re on the right side of the price move, that’s a great thing. But if you’re on the wrong side of the move, not so great. Consequently, by minimizing the effect of the post-EA price move, you have a much better chance to profit from the reduction in IV without it being ruined by a violent price move.

For this trade, open the position either (1) the night before the EA when the company announces earnings or (2) during the EA day when it announces post-market, generally capturing IV at or close to its peak.

For this trade, open the position either (1) the night before the EA when the company announces earnings or (2) during the EA day when it announces post-market, generally capturing IV at or close to its peak.

This popular stockearnings screen will give you a list of stocks which do not react more than 4% fpost-EA. It includes only those stocks whose earnings are releasing next day.

Screen criteria:

  1. Earnings Date Start Date : Current Date + 1
  2. Earnings Date End Date : Current Date + 1
  3. Predicted Move (Next Day) Max : 4%
  4. Options Type: Weekly

Strategy Guideline:

  1. Options Strategy: Sell Call and Put
  2. Options Strike Price: Current Stock Price – (% Predicated Move x 2)
  3. Expiration Date: It should generally be the closest expiry immediately after the EA.
  4. Buy Insurance: Buying back Call and Put at Strike price which 10% lower than Sell Strike Price is optional but recommended.

Watch Video for More Detail

Volatility Rush Strategy - Best for Options Traders

The Volatility Rush takes advantage of increasing options premiums into earnings announcements (EA) caused by an anticipated rise in Implied Volatility (IV). With this strategy, Buy a Call and Put at-the-money (a long straddle) 2-3 weeks before the EA when IV is lower. Sell the position either (1) the night before the EA when the company announces earnings pre-market, or (2) during the EA day when it announces post-market, generally capturing IV at or close to its peak.

This popular screen will give you a list of stocks whose Options premiums tend to rise into Earnings. It includes only those stocks whose Earnings are at least two weeks away from today.

Screen criteria:

  1. Earnings Date Start Date : Current Date + 15 Days
  2. Earnings Date End Date : Current Date + 30 Days
  3. Predicted Move (Next Day) Min : 5%
  4. Options Type: Weekly or Monthly if that lines up with the two to three-week lead-time for entering the trade

Strategy Guideline:

  1. Buy a Straddle at or close to the money two to three weeks pre-EA.
  2. Sell the position either the night before the EA when the company announces earnings pre-market, or during the EA day when it announces post-market.
  3. Expiration date should generally be the closest expiry immediately after the EA.
  4. Straddle price should not be more 60% of predicted move.

Predicted Move (Volatility)

Similar to Implied Volatility in Options. Expected volatility % based on our Proprietary Volatility Predication Model. We are expecting that stock price will likely to reach % in either direction by the end of next trading session after Earnings are released and not necessarily the closing volatility %.

Why is it important?

    This indicator helps

  1. Knowing expected volatility in stocks after Earnings helps to decide trading stocks before Earnings Announcement.
  2. Taking Advantage of volatility collapse following Earnings Results by using Advance Options strategies such as Spread and Straddles.

Since Last Earnings

Change in share price since last Earnings release.

Why is it Important?

When share has gained more than 10% since it's last Earning release, it tends to over react to minor bad news and give up some gains if not all. So, it contains more downside volatility than upside When share has dropped more than 10% since it's last Earning release, it tends to over react to minor good news and recover some drops if not all. So, it contains more upside volatility than downside.

EPS Surprise (%)

Occurs when a company's reported quarterly or annual profits are above or below analysts' expectations. Here is the formula to derive % EPS Surprice:

Actual EPS - Estimated EPS
------------------------------------- x 100
Estimated EPS

Why is it Important?

Earnings surprises can have a huge impact on a company's stock price. Several studies suggest that positive earnings surprises not only lead to an immediate hike in a stock's price, but also to a gradual increase over time. Hence, it's not surprising that some companies are known for routinely beating earning projections. A negative earnings surprise will usually result in a decline in share price.

Next Day Price Change (%)

Next Regular trading session Closing price following Earnings result.

For After Market Close Earnings, It is a next trading day closing price. For Before Market Open Earnings, It is the same trading day closing price.

Why is it Important?

Next Day price change is a reaction of Earnings result.

Dollar Store Earnings: 2 Different Consumers Keep a Lid on Gains

Posted on Aug 31, 2026 by Chris Markoch

Dollar Store Earnings: 2 Different Consumers Keep a Lid on Gains

In the week of Aug. 24, dollar store bellwethers Dollar General (NYSE: DG) and Dollar Tree (NASDAQ: DLTR) reported quarterly earnings. The results were the same…as was the market reaction. That reaction, combined with renewed concerns about inflation, may limit gains in both stocks.  

The headwind that hung over the headline results from each company was the consumer. Dollar stores cater to lower-income consumers. Dollar General takes that one step further with a business model that ensures its stores are located in areas that are a short drive for its consumers.  

However, the health of that consumer told the real story of this earnings season. Both dollar stores reported that lower-income consumers were limiting their discretionary purchases to focus on staples. Data like this reinforces the idea that a bifurcated consumer is a key consideration for retailers heading into the all-important holiday season. 

On the other hand, like Walmart (NASDAQ: WMT), Dollar General and Dollar Tree reported increased traffic from higher-income consumers who are looking for value. That lays out the investment case. Will higher-income consumers drive future results for dollar stores, or will a stressed core consumer put a lid on future gains?  

Dollar General: Traffic Keeps Coming Back 


Dollar General’s second-quarter report gave investors plenty to like on the surface. Net sales rose 5.2% to $11.3 billion, while same-store sales climbed 3.5%, split between a 2% gain in customer traffic and a 1.5% increase in average ticket. That marked the fifth straight quarter of traffic growth and the sixth consecutive quarter of positive comps across all four merchandising categories — consumables, seasonal, home products and apparel all posted gains. 

The bottom line looked even better. Operating profit jumped 29.2% to $769.2 million, and diluted EPS surged 33.3% to $2.48, helped by an estimated $0.25 per share benefit from tariff refunds. Gross margin expanded 127 basis points to 32.6%, aided by those refunds along with a lower LIFO provision and reduced distribution costs. CEO Todd Vasos called the results a “testament to the strong execution” of the company’s turnaround strategy, and the traffic trend backs that up — it’s harder to dismiss as a one-quarter blip when it’s now stretched across more than a year. 

Management used the strength to raise full-year guidance across the board. Dollar General now expects net sales growth of 4% to 4.3%, same-store sales growth of 2.5% to 2.9%, and diluted EPS of $7.80 to $8, up from a prior range of $7.20 to $7.45. The company also plans to repurchase up to $700 million in stock this year and continues to pay a quarterly dividend of 59 cents per share. 

Dollar Tree: Margins Do the Heavy Lifting 

Dollar Tree’s quarter told a similar growth story with a different engine underneath. Total sales rose 7.0%, and comparable store net sales increased 3.7%, but unlike Dollar General, the gain leaned heavily on ticket, up 3.3%, while traffic contributed just 0.4%. That’s a subtle but important distinction for a stock now trading as a standalone business following last year’s Family Dollar divestiture. 

The headline numbers were flattered by tariff refunds. Diluted EPS came in at $2.70, including a $1.31 per-share benefit tied to the net impact of those refunds, and operating margin expanded 900 basis points, 650 of which came from the same source. Strip that out, and the underlying improvement still reflects real progress: the multi-price rollout now covers roughly 6,600 stores, and discretionary categories are gaining share as the format matures. 

Dollar Tree used the quarter to return $605 million to shareholders through buybacks and raised its full-year adjusted EPS outlook to a range of $7.70 to $8.05. Its third-quarter guidance calls for comparable sales growth of 3% to 4%, though adjusted EPS of $0.80 to $0.95 will absorb roughly $0.50 per share in reinvestment costs tied to those tariff refunds. 

Two takeaways for investors. First, this quarter’s tailwind won’t repeat indefinitely. Second, with the Family Dollar overhang gone and the balance sheet holding $1.1 billion in cash, Dollar Tree now has more room to keep investing in its stores without leaning as hard on financial engineering to show progress. 

Tale of the Tape: The Charts Look Very Similar 

As you might expect, the stock charts for DG and DLTR look remarkably similar. Both stocks dropped sharply in the first half of the year. Both have recovered in the last three months and now sit right around their respective 50-day simple moving averages.  
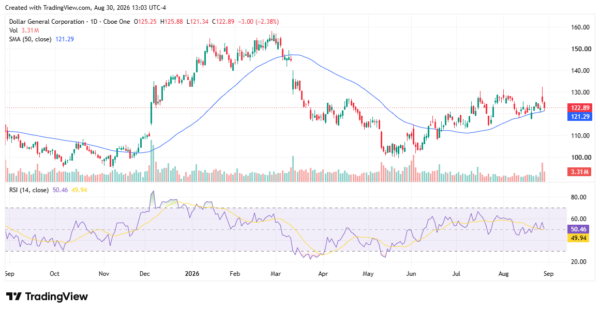
dollar store - StockEarnings

The Relative Strength Indicator for each is supportive of a bullish move higher. However, neither stock is displaying particularly strong momentum. While that could prevent a bullish rally, it’s also a sign that much of the pessimism may already be priced in.  
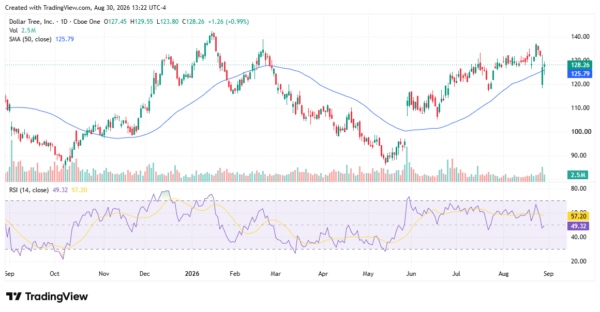
dollar store - StockEarnings

Which Dollar Store Stock Offers Better Upside? 

Analysts are generally bullish on each dollar store. However, Dollar General may be the better choice for investors who are choosing between the two. For starters, DG has more current upside to the analysts’ consensus price targets and is trading almost exactly in the middle of its 52-week range. 

Income investors get another benefit with Dollar General: that 59 cents-per-share dividend. The yield of 1.93% as of this writing isn’t particularly impressive. However, the dividend has a payout ratio of around 30%, making it a safe choice for investors who rely on the income for current cash or as part of a reinvestment strategy.  

Investors can’t change the state of the consumer, which is likely to be in flux for several quarters. But that doesn’t mean that they can’t profit from that uncertainty. The strong earnings reports from Dollar General and Dollar Tree are reminders of the fundamental strengths that each dollar store offers. That strength can help you weather the current uncertainty and set you up for meaningful upside when the company’s core consumer is on firmer ground.  

A former marketing copywriter turned freelance financial writer and market analyst. I have a passion for delivering insights to investors. I write regularly about stocks for StockEarnings and MarketBeat. Posts are not advice.

Join over 1.2M+ investors/traders who receive daily and weekly notable earnings alerts with predicted move
