ajax loader

Loading...


Ride-the-Wave Strategy – Best for Stock Traders

Ride-the-Wave targets multi-day price momentum following a company’s earnings announcement (EA). With this strategy:

  1. Buy a stock one day post-EA if a stock reacts positively post-earnings:
    1. Near the close of trading the EA-day for a pre-market-EA
    2. Near the close of the following day for a post-market-EA
  2. Sell-to-close after 7-10 days, or possibly earlier if a desired price target is reached

Similarly,

  1. short a stock one day post-EA if a stock reacts negatively post-earnings:
    1. near the close of trading the EA-day for a premarket-EA
    2. near the close of the following day for a post-market-EA
  2. then buy-to-close after 7-10 days, or possibly earlier if a desired price target is reached

Important: Ride-the-Wave is predicated on significant price momentum triggered by an EA. The 7-10 day scenario is the maximum trade hold-time. If you see post EA-momentum is halted or reversed by a significant opposite move, re-evaluate your presence in the trade.

This popular StockEarnings screen below will give you a list of stocks that historically exhibit significant price momentum following an EA for the next seven days:

  1. Stocks exhibiting positive post-EA price moves are buy-candidates
  2. Stocks exhibiting negative post-EA price moves are sell/short-candidates

The screen includes those stocks whose Earnings just came out in last two days.

Screen criteria:

  1. Earnings Date Start Date : Current Date + -1 Day
  2. Earnings Date End Date : Current Date + -2 Days
  3. Predicted Move (Next Day) Max : 7%
  4. Predicted Move (On 7th Day) Min : 7%

Strategy Guideline:

  1. Buy the stock if stock has reacted positively. Short the stock if stock has reacted negatively (see above).
  2. Close the position in 7-10 days, or possibly earlier based on price move.

Volatility Crush Strategy - Best for Options Traders

The Volatility Crush strategy is used with stocks that typically experience relatively low-to-moderate price moves (≤4%) following their Earnings Announcements (EA). The basic trade idea is to sell put or call options right before the EA, collecting a credit when options premium is very high due to elevated implied volatility (IV). You then close the position right after the EA by buying the option back much cheaper due to the significant drop in IV that occurs after the mystery of the EA disappears. In assessing this trade, you need to do your homework to ensure you collect sufficient premium to make the trade worthwhile.

This trade is practical due to the low-to-moderate price-move after the EA, which generally won’t significantly affect the options price, unlike an “action” stock, which experience great price moves post-EA. With these symbols, if you’re on the right side of the price move, that’s a great thing. But if you’re on the wrong side of the move, not so great. Consequently, by minimizing the effect of the post-EA price move, you have a much better chance to profit from the reduction in IV without it being ruined by a violent price move.

For this trade, open the position either (1) the night before the EA when the company announces earnings or (2) during the EA day when it announces post-market, generally capturing IV at or close to its peak.

For this trade, open the position either (1) the night before the EA when the company announces earnings or (2) during the EA day when it announces post-market, generally capturing IV at or close to its peak.

This popular stockearnings screen will give you a list of stocks which do not react more than 4% fpost-EA. It includes only those stocks whose earnings are releasing next day.

Screen criteria:

  1. Earnings Date Start Date : Current Date + 1
  2. Earnings Date End Date : Current Date + 1
  3. Predicted Move (Next Day) Max : 4%
  4. Options Type: Weekly

Strategy Guideline:

  1. Options Strategy: Sell Call and Put
  2. Options Strike Price: Current Stock Price – (% Predicated Move x 2)
  3. Expiration Date: It should generally be the closest expiry immediately after the EA.
  4. Buy Insurance: Buying back Call and Put at Strike price which 10% lower than Sell Strike Price is optional but recommended.

Watch Video for More Detail

Volatility Rush Strategy - Best for Options Traders

The Volatility Rush takes advantage of increasing options premiums into earnings announcements (EA) caused by an anticipated rise in Implied Volatility (IV). With this strategy, Buy a Call and Put at-the-money (a long straddle) 2-3 weeks before the EA when IV is lower. Sell the position either (1) the night before the EA when the company announces earnings pre-market, or (2) during the EA day when it announces post-market, generally capturing IV at or close to its peak.

This popular screen will give you a list of stocks whose Options premiums tend to rise into Earnings. It includes only those stocks whose Earnings are at least two weeks away from today.

Screen criteria:

  1. Earnings Date Start Date : Current Date + 15 Days
  2. Earnings Date End Date : Current Date + 30 Days
  3. Predicted Move (Next Day) Min : 5%
  4. Options Type: Weekly or Monthly if that lines up with the two to three-week lead-time for entering the trade

Strategy Guideline:

  1. Buy a Straddle at or close to the money two to three weeks pre-EA.
  2. Sell the position either the night before the EA when the company announces earnings pre-market, or during the EA day when it announces post-market.
  3. Expiration date should generally be the closest expiry immediately after the EA.
  4. Straddle price should not be more 60% of predicted move.

Predicted Move (Volatility)

Similar to Implied Volatility in Options. Expected volatility % based on our Proprietary Volatility Predication Model. We are expecting that stock price will likely to reach % in either direction by the end of next trading session after Earnings are released and not necessarily the closing volatility %.

Why is it important?

    This indicator helps

  1. Knowing expected volatility in stocks after Earnings helps to decide trading stocks before Earnings Announcement.
  2. Taking Advantage of volatility collapse following Earnings Results by using Advance Options strategies such as Spread and Straddles.

Since Last Earnings

Change in share price since last Earnings release.

Why is it Important?

When share has gained more than 10% since it's last Earning release, it tends to over react to minor bad news and give up some gains if not all. So, it contains more downside volatility than upside When share has dropped more than 10% since it's last Earning release, it tends to over react to minor good news and recover some drops if not all. So, it contains more upside volatility than downside.

EPS Surprise (%)

Occurs when a company's reported quarterly or annual profits are above or below analysts' expectations. Here is the formula to derive % EPS Surprice:

Actual EPS - Estimated EPS
------------------------------------- x 100
Estimated EPS

Why is it Important?

Earnings surprises can have a huge impact on a company's stock price. Several studies suggest that positive earnings surprises not only lead to an immediate hike in a stock's price, but also to a gradual increase over time. Hence, it's not surprising that some companies are known for routinely beating earning projections. A negative earnings surprise will usually result in a decline in share price.

Next Day Price Change (%)

Next Regular trading session Closing price following Earnings result.

For After Market Close Earnings, It is a next trading day closing price. For Before Market Open Earnings, It is the same trading day closing price.

Why is it Important?

Next Day price change is a reaction of Earnings result.

Super Micro (SMCI) Just Gave The Bulls Their Best Argument Yet

Posted on Aug 12, 2026 by Grayson Cavern

Super Micro (SMCI) Just Gave The Bulls Their Best Argument Yet

Super Micro Computer (NASDAQ: SMCI) has spent the better part of the past year fighting investors’ distrust that has made SMCI one of the market’s most polarizing AI plays. The company reported $11.12 billion in fiscal Q4 revenue, up 93% year over year but below the roughly $11.56 billion analyst consensus, while adjusted EPS came in at $1.70, comfortably ahead of the roughly $0.96 expected. 

Wall Street’s first reaction was pretty telling as SMCI closed the regular session at $31.60, then jumped to roughly $34 after hours, a gain of about 7.6%. But for a stock this controversial, a one-night pop doesn’t settle much. The question is whether this quarter represents a change in the economics of the business… or just another moment when Supermicro gives the bulls something to cheer about before the skeptics come back swinging.

17.6% Gross Margins Change The SMCI Debate


The easiest way to dismiss Super Micro has always been to point at the revenue growth and ask where the profits went, because a company can sell billions of dollars of AI infrastructure and still leave shareholders with surprisingly little at the bottom. Q4 made that argument a lot harder: non-GAAP gross margin reached 17.6%, up from 10.1% in Q3 and 9.6% a year earlier, while non-GAAP operating margin climbed to 14.3% from 7.2% sequentially. 

Management deserves some credit for explaining where the jump came from instead of simply waving at AI demand: roughly 75% of the 750-basis-point sequential gross-margin improvement came from customer and product mix, while lower tariff costs and lower inventory reserves accounted for the remaining 25%. 

And that is where the Q4 earnings report starts pushing back against the idea that SMCI is simply an AI server reseller living off the NVIDIA (NASDAQ: NVDA) boom, because management says it is deliberately moving toward a Data Center Building Block Solutions model that bundles GPU and CPU servers, storage, liquid cooling, networking, software and lifecycle services into a single deployment.

The truth is, if Supermicro can sell more of the data center around the GPU, it has more opportunities to capture margin than it does by simply moving expensive hardware from one customer to another.

$60 Billion In Orders Won’t Silence SMCI’s Cash-Flow Critics

Supermicro has no shortage of customers willing to place enormous orders; the harder sell is convincing investors that those orders can become cash without requiring the balance sheet to swallow another giant working-capital bill. FY26 operating cash flow was negative $6.8 billion, even as the company reported $2.23 billion of net income, and inventory climbed to $12.9 billion at the end of Q4 from $11.1 billion just three months earlier. 

Supermicro says it was building inventory ahead of higher FY27 revenue, and there is some evidence that the working-capital picture is already improving: Q4 operating cash flow swung to $747 million from a $6.6 billion outflow in Q3, while days sales outstanding fell from 85 to 59 days as the company collected from some large customers. 

Still, days inventory outstanding rose to 119 days and the overall cash-conversion cycle stretched from 106 to 149 days, so the balance sheet is carrying a lot of the burden of this growth story. The $5.6 billion raised through common stock and mandatory convertible preferred shares gives Supermicro plenty more room to fund the next wave of orders, but it also means existing shareholders have paid a price for that financial flexibility. 

That leaves me with a much more useful test for FY27 than simply asking whether Supermicro can hit $65 billion–$72 billion in revenue: can it grow at that pace without consuming another mountain of cash to do it? If the answer starts showing up in the cash-flow statement, some of the market’s distrust has a real chance of fading; if revenue keeps exploding while working capital keeps eating the profits, the skeptics will have plenty of ammunition left.

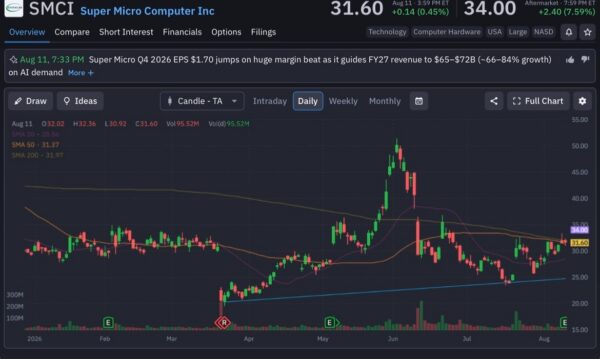
SMCI Has Finally Reclaimed Its 200-Day Average

SMCI’s chart is giving the bulls something useful to work with after months of going nowhere, with the stock closing at $31.60 and moving above its $31.97 200-day moving average in after-hours trading, while the earnings reaction pushed shares to roughly $34. The move also came with 95.5 million shares traded during the regular session, a meaningful burst of volume after the stock spent much of July and early August grinding around the high-$20s and low-$30s. 

The immediate test is now $34–$35, where the stock has repeatedly struggled since the June collapse, while the $31–$32 area becomes the level I’d want to see hold if the earnings pop cools off. A clean break above $35 would put the mid-$30s back in play; lose the 200-day average again and this starts looking more like another earnings-driven spike than a genuine change in trend.

The market isn’t giving SMCI a free pass yet, but for a stock this controversial, reclaiming the 200-day on a monster earnings-volume reaction is a pretty damn good place to start.
smci-StockEarnings

SMCI Has Few Quarters To Prove Itself

The catch is that one quarter doesn’t prove the model works, particularly when management acknowledges that favorable mix and a few one-time positive contributions helped Q4 margins.  The next few quarters need to show that 17.6% wasn’t a beautiful outlier. If SMCI can keep margins materially above the 10%-ish range investors have become accustomed to while growing toward its $65 billion–$72 billion FY27 revenue target, the market may finally have to rethink what this company is worth.

For now, I wouldn’t ask investors to forget everything that made SMCI one of the market’s most distrusted AI names; I’d ask them to watch the margins holding, cash conversion improving and $60 billion-plus of new orders turning into revenue without another working-capital blowout, which would give the bulls something to latch on to.


Join over 1.2M+ investors/traders who receive daily and weekly notable earnings alerts with predicted move