Marriott International (NASDAQ: MAR) is flat-out risky — you don’t need me to state the obvious. Although MAR stock is up around 13%, which is respectable for the global hospitality giant, it faces concerns regarding broader economic challenges. With rising cost-of-living concerns, the concept of people spending lavishly on vacations has taken a hit.
That said, Marriott is a fundamentally sound business and a well-recognized brand. Short of a catastrophic economic implosion, it’s doubtful that the company will collapse. As such, given the recent underperformance of MAR stock — which includes a trailing-month decline of about 4% — it’s possible that institutional and professional players may view the deflated ticker as a discounted opportunity.
Basically, the idea revolves around mean reversion. It’s not that every public security that tumbles will eventually rise (because that’s obviously not the case). Rather, the equity of robust, relevant enterprises — like Marriott stock — is unlikely to stay deflated indefinitely. And I don’t think I’m saying anything out of the ordinary here.
However, what separates analyses on the topic is the underlying methodology. Yes, I would say that most people believe in mean reversion. But estimating when this mean reversion will likely happen — and where the target security may go — represents an entirely different matter.
It’s here that MAR stock offers an unusual circumstance. Using two methodologies — borrowed from technical and quantitative analysis — Marriott may be signaling an upside move soon.
MAR Stock May Have Flashed a Doji Star
Before I get into the technical argument for Marriott stock, I must admit that I’ve fallen out of love with the underlying discipline. Frankly, I don’t place much faith in chart patterns and moving averages because of the lack of a baseline rate or denominator.
For example, chartists are quick to point out a head-and-shoulders pattern but rarely do they tell me how many such patterns have materialized — and which ones have failed to produce the desired result. Generally, then, we’re often working with a sample size of one.
 Source: Stockcharts.com
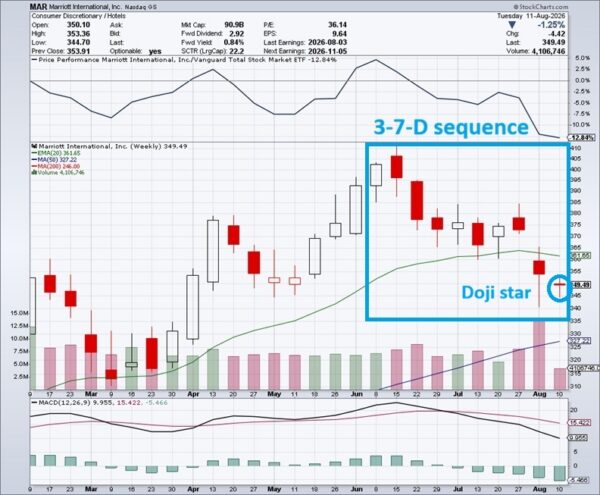
Keep that in mind as I tell you that, on the weekly chart of MAR stock, the ticker is currently printing what appears to be a doji star. This candlestick pattern represents an identical (or near-identical) opening and closing price of the session (in this case, weekly). Colloquially, the pattern resembles a symmetrical cross.
Because the doji star has appeared below the candlestick body of the prior session, technical analysis teaches us that the next candlestick (session) is likely to gap higher. What is the probability of this move? I don’t think anyone knows. As far as I’m concerned, much of technical analysis is fan fiction written on the fly.
Still, I did find the pattern coincidentally interesting because of the real reason why I’m focusing on MAR stock: order flow imbalance.
Marriott Stock Could be Poised for a Breakout Move
I’m going to share how I decide what tickers to cover. Every day, I run an algorithm filtering securities by order flow balance across a rolling 10-week sequence. I’m particularly interested — as I’m sure you all are — in stocks that have suffered a long series of negative sessions.
As I mentioned, some tickers are just plain garbage. MAR stock isn’t one of them — but it’s also not something that immediately grabs your attention. Let’s face facts here; when you think about Marriott, you’re usually looking for a place to stay, not for a place to invest. Certainly, nobody’s getting hot and bothered about trading MAR options.
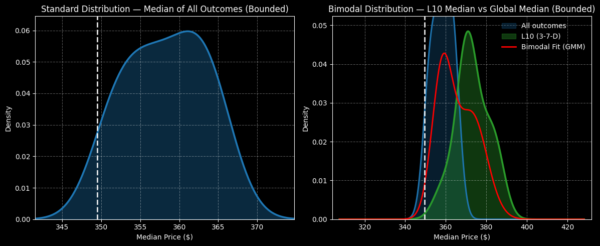
Nevertheless, we may have a compelling opportunity on our hands here. Marriott stock represents a sound business and so, when it’s deflated, you’d expect Wall Street’s top dogs to be interested in the discount. Quantitatively, MAR printed only three up weeks in the last 10 weeks, leading to a downward slope. On the surface, that’s a bearish signal.
However, if we presuppose that the red ink may be considered a discount, suddenly, the nature of the beast changes. Not only that, we can look back in prior pricing history to find exact examples of this 3-7-D quant sequence.
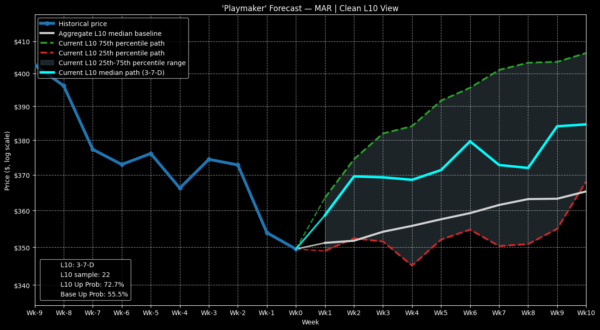
As it turns out, whenever this signal flashes, MAR stock has demonstrated a higher probability of swinging upward — much more so than under random, aggregate conditions. Specifically, over the course of the next 10 weeks, the signal has resulted in a peak median probability density of around $370 (assuming a starting price of $349.49, Tuesday’s close).
On a random 10-week hold? You’re looking at a peak probability density of $362. This comparison translates to about a 2.2% positive variance. With the leverage of an options spread, you may be looking at an exploitable edge.
Targeting the $380 Strike Price
Now, what we must realize is that the positive variance isn’t necessarily linear and orderly. During some forecasted weeks, Marriott stock could move in an unusually robust manner. Based on the data, this extra kick — a positive volatility cluster — may materialize around week 6 following the flashing of the 3-7-D signal.
Given this inductive analysis, I’m interested in the 370/380 bull call spread expiring Sep. 18. This trade requires a net debit of $450 (which is the most that can be lost), with the hope that MAR stock rises through the $380 strike price at expiration. If so, the move will trigger a maximum payout (profit) of $550.
Now, where it gets super-interesting is that Wall Street — using the Black-Scholes model — calculates a subterranean 19.2% probability that the above spread will break even at $374.50. However, based on my inductive model and Markov chain simulation, the probability of full profitability (at $380) is 45.5%.
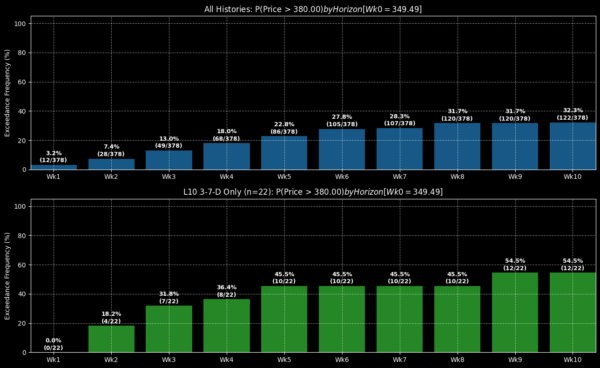
How did I arrive at these odds? Of the 22 times that MAR stock flashed the 3-7-D signal, the ticker rose above the equivalent of the $380 strike price a total of 10 times at the end of week 6. That’s 45.5%.
Let’s run an expected value (EV) calculation. Over the long run, you’ll win the max payout 45.5% of the time ($250.25) while losing the entire net debit 54.5% of the time ($245.25). Over the long run, should you run this identical trade, you would be looking at a net gain of $5.
Caveats to Consider
A clear warning must be given: I don’t know the future and nothing in the market is guaranteed. All I’m doing here is filtering specific circumstances from past data and estimating where Marriott stock may head next. From most occurrences of the 3-7-D signal since January 2019, MAR has tended to move higher.
Will it move higher this time around? That’s the million-dollar question — and again, nobody knows. But I am someone who feels more comfortable playing the odds than just randomly guessing. And so, if you give the inductive model credence, then MAR stock may be an idea worth paying attention to.

