Given the wider uncertainty in the global markets, Meta Platforms (NASDAQ: META) may not be the most awe-inspiring proposition for long-term investors. META stock has been exceptionally choppy this year and getting the call wrong could lead to sharp consequences — the ticker’s year-to-date loss of almost 17% sees to that. However, for aggressive options traders, the volatility could open doors.
Despite the criticisms that Meta Platforms attracts, the tech juggernaut is undeniably a relevant player in multiple arenas, such as social media (and therefore data mining) and artificial intelligence. As such, whenever META stock encounters weakness — especially prolonged weakness — it’s very possible that institutional players may view the red ink as an opportunity.
On a technical note, I’m talking about mean reversion, the idea that pressured securities of top-tier organizations will naturally swing higher toward previously established trend lines. While the concept probably isn’t too controversial — since I’d imagine that most people accept the underlying premise — it does become contentious when discussing methodologies.
Often, technical analysts will draw arbitrary support and resistance lines on charts, suggesting that there’s a high probability of a bounce back following a corrective cycle. But the denominator is rarely (if ever) provided, meaning that the reader is left with only a vague vibe check as the justification for the forecasted move. That’s why I prefer quantitative analysis, using hard numbers to build a short-term trading case.
Is the quantitative approach foolproof? Absolutely not — there’s simply no way to guarantee an outcome in the reflexive equities market. However, my theory is that we can build an inductive case; that is, infer where Meta Platforms stock may go based on prior trends of similar circumstances.
With the tech ticker, it has printed only three positive weekly candlesticks in the last 10 sessions. That’s two months where META stock suffered negative pressure, resulting in a downward trend across the period. While that’s bearish on paper, it’s the historically observed response that I find fascinating.
Now, the question you might be asking is, what’s the big deal with this 3-7-D (3 up, 7 down, downward slope) quantitative sequence? If you were to chop up the price history of Meta Platforms stock in 10-week discretized sequences, you’re bound to get a variety of combinations.
Certainly, I agree with that conclusion — but here’s where the theory comes in. I’m proposing that not all combinations are equal. Essentially, the market is going to react differently to a 3-7-D sequence rather than its counterpart, the 7-3-U sequence. In the former, the weak hands have likely been driven out of META stock. With the latter, the weak hands have moved in.
From a contrarian view, it may not be advisable to bid up a security when it has already soaked up considerable FOMO (fear of missing out) money. There are exceptions, such as when I noted that PayPal (NASDAQ: PYPL) printed an 8-2-U signal, which historically has led to an upswing. Still, that was a rare example where extreme bullishness led to further bullishness (which I called almost to the dollar). Usually, though, contrarians prefer buying weakened names that are poised to move higher.
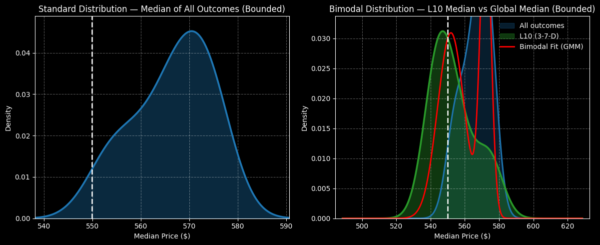
That’s the potential opportunity at hand for Meta Platforms stock. Under the 3-7-D configuration, META typically sees a swing higher over the next five weeks, with endpoint median performance expectations ranging between 1% and 4% from Friday’s closing price of $549.90.
You might be thinking that such a modest range isn’t worthwhile for a straight-up trade and you’d be right. But the plot twist is that we’re not going to engage in a straight trade. Instead, we’ll be considering the leverage of options, specifically the bull call spread.
Based on the inferred data above, I’m looking at the 555/565 bull call spread expiring Sep. 18. This trade requires a net debit of $460 in the hopes that Meta Platforms stock triggers the $565 second-leg strike at expiration. If it does, the maximum profit would be $540 or a payout of over 117%.
That’s not a bad conversion for a modest move higher — but as you might expect, there’s a catch here.
Mathematically, when I refer to median endpoint performances, I mean that at the end of the selected week, half of the outcomes have exceeded the forecasted target while the other half has dropped below it. While this implies a 50% probability of success, that’s not what Wall Street is seeing for the aforementioned Sep. 18 555/565 bull spread.
Instead, the Street’s options pricing mechanism assigns a probability of breakeven (at $559.60) of only 42.7%. Making matters worse, the odds that META stock will hit the $565 strike at expiration are set at 39.72%. Because there’s a lot of money at stake for each spread, many traders may find this proposition to be undesirable.
However, the low odds stem from a key assumption undergirding the standard Black-Scholes formula for options pricing. Without getting mired in the complex math, Wall Street’s model believes that Meta Platforms stock will undergo a random walk between now and the expiration date, with the current implied volatility assumed as the constant “fuel” throughout the journey.
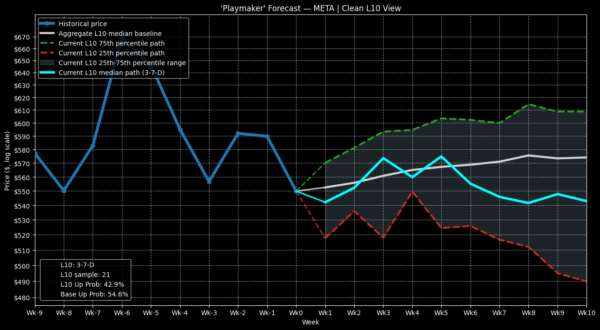
Imagine that over the next four weeks to Sep. 18, time is broken into several individual slices, with each slice determined by a coin toss. After thousands of these coin tosses, the chances that META stock will land on $565 is around 40%.
Despite the pessimistic math, I believe that the tech giant will undergo a nonrandom journey. Why do I believe this? As I mentioned earlier, Meta Platforms stock is structured in a 3-7-D sequence. This setup represents a negative order flow imbalance, which should result in a nonrandom response. Based on prior data, the subsequent move has historically been positive.
Inferences are Imperfect
Running a Markov chain simulation on data since January 2019, the observed odds that META stock will hit the $565 strike price come out to 47.6%. However, the chance that it will hit the breakeven price of $559.60 is 57.1%. In theory, because these ratios are superior to the random walk assumption, META appears underpriced relative to the “true” risk you would be taking.
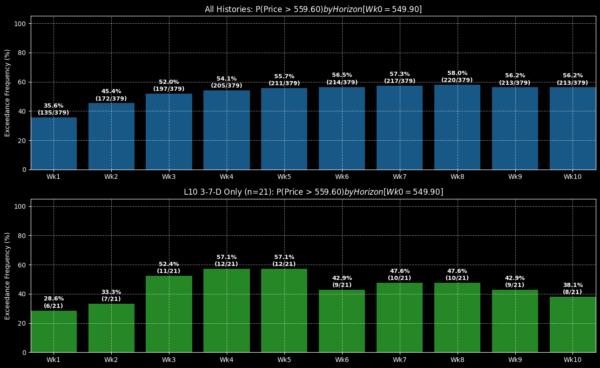
But is that really the case? Frankly, nobody knows the future until it actually materializes. One of the challenges of the model above is the very low sample size of 21 occurrences of the 3-7-D signal on a rolling basis. That’s not much to go by, meaning that the implication is low confidence.
Also, all inductive models face the Black Swan risk. Just because a pattern has been observed repeatedly in the past does not mean it will evolve as expected in the future. Therefore, you should never treat models — any model — as guarantees.
Nevertheless, I firmly believe that in a chaotic, reflexive system, inductive models are the best tools that we have for deciphering what may happen next in the equities market. If you feel the same, the Sep. 18 555/565 bull spread may be worth closer investigation.

