ajax loader

Loading...


Ride-the-Wave Strategy – Best for Stock Traders

Ride-the-Wave targets multi-day price momentum following a company’s earnings announcement (EA). With this strategy:

  1. Buy a stock one day post-EA if a stock reacts positively post-earnings:
    1. Near the close of trading the EA-day for a pre-market-EA
    2. Near the close of the following day for a post-market-EA
  2. Sell-to-close after 7-10 days, or possibly earlier if a desired price target is reached

Similarly,

  1. short a stock one day post-EA if a stock reacts negatively post-earnings:
    1. near the close of trading the EA-day for a premarket-EA
    2. near the close of the following day for a post-market-EA
  2. then buy-to-close after 7-10 days, or possibly earlier if a desired price target is reached

Important: Ride-the-Wave is predicated on significant price momentum triggered by an EA. The 7-10 day scenario is the maximum trade hold-time. If you see post EA-momentum is halted or reversed by a significant opposite move, re-evaluate your presence in the trade.

This popular StockEarnings screen below will give you a list of stocks that historically exhibit significant price momentum following an EA for the next seven days:

  1. Stocks exhibiting positive post-EA price moves are buy-candidates
  2. Stocks exhibiting negative post-EA price moves are sell/short-candidates

The screen includes those stocks whose Earnings just came out in last two days.

Screen criteria:

  1. Earnings Date Start Date : Current Date + -1 Day
  2. Earnings Date End Date : Current Date + -2 Days
  3. Predicted Move (Next Day) Max : 7%
  4. Predicted Move (On 7th Day) Min : 7%

Strategy Guideline:

  1. Buy the stock if stock has reacted positively. Short the stock if stock has reacted negatively (see above).
  2. Close the position in 7-10 days, or possibly earlier based on price move.

Volatility Crush Strategy - Best for Options Traders

The Volatility Crush strategy is used with stocks that typically experience relatively low-to-moderate price moves (≤4%) following their Earnings Announcements (EA). The basic trade idea is to sell put or call options right before the EA, collecting a credit when options premium is very high due to elevated implied volatility (IV). You then close the position right after the EA by buying the option back much cheaper due to the significant drop in IV that occurs after the mystery of the EA disappears. In assessing this trade, you need to do your homework to ensure you collect sufficient premium to make the trade worthwhile.

This trade is practical due to the low-to-moderate price-move after the EA, which generally won’t significantly affect the options price, unlike an “action” stock, which experience great price moves post-EA. With these symbols, if you’re on the right side of the price move, that’s a great thing. But if you’re on the wrong side of the move, not so great. Consequently, by minimizing the effect of the post-EA price move, you have a much better chance to profit from the reduction in IV without it being ruined by a violent price move.

For this trade, open the position either (1) the night before the EA when the company announces earnings or (2) during the EA day when it announces post-market, generally capturing IV at or close to its peak.

For this trade, open the position either (1) the night before the EA when the company announces earnings or (2) during the EA day when it announces post-market, generally capturing IV at or close to its peak.

This popular stockearnings screen will give you a list of stocks which do not react more than 4% fpost-EA. It includes only those stocks whose earnings are releasing next day.

Screen criteria:

  1. Earnings Date Start Date : Current Date + 1
  2. Earnings Date End Date : Current Date + 1
  3. Predicted Move (Next Day) Max : 4%
  4. Options Type: Weekly

Strategy Guideline:

  1. Options Strategy: Sell Call and Put
  2. Options Strike Price: Current Stock Price – (% Predicated Move x 2)
  3. Expiration Date: It should generally be the closest expiry immediately after the EA.
  4. Buy Insurance: Buying back Call and Put at Strike price which 10% lower than Sell Strike Price is optional but recommended.

Watch Video for More Detail

Volatility Rush Strategy - Best for Options Traders

The Volatility Rush takes advantage of increasing options premiums into earnings announcements (EA) caused by an anticipated rise in Implied Volatility (IV). With this strategy, Buy a Call and Put at-the-money (a long straddle) 2-3 weeks before the EA when IV is lower. Sell the position either (1) the night before the EA when the company announces earnings pre-market, or (2) during the EA day when it announces post-market, generally capturing IV at or close to its peak.

This popular screen will give you a list of stocks whose Options premiums tend to rise into Earnings. It includes only those stocks whose Earnings are at least two weeks away from today.

Screen criteria:

  1. Earnings Date Start Date : Current Date + 15 Days
  2. Earnings Date End Date : Current Date + 30 Days
  3. Predicted Move (Next Day) Min : 5%
  4. Options Type: Weekly or Monthly if that lines up with the two to three-week lead-time for entering the trade

Strategy Guideline:

  1. Buy a Straddle at or close to the money two to three weeks pre-EA.
  2. Sell the position either the night before the EA when the company announces earnings pre-market, or during the EA day when it announces post-market.
  3. Expiration date should generally be the closest expiry immediately after the EA.
  4. Straddle price should not be more 60% of predicted move.

Predicted Move (Volatility)

Similar to Implied Volatility in Options. Expected volatility % based on our Proprietary Volatility Predication Model. We are expecting that stock price will likely to reach % in either direction by the end of next trading session after Earnings are released and not necessarily the closing volatility %.

Why is it important?

    This indicator helps

  1. Knowing expected volatility in stocks after Earnings helps to decide trading stocks before Earnings Announcement.
  2. Taking Advantage of volatility collapse following Earnings Results by using Advance Options strategies such as Spread and Straddles.

Since Last Earnings

Change in share price since last Earnings release.

Why is it Important?

When share has gained more than 10% since it's last Earning release, it tends to over react to minor bad news and give up some gains if not all. So, it contains more downside volatility than upside When share has dropped more than 10% since it's last Earning release, it tends to over react to minor good news and recover some drops if not all. So, it contains more upside volatility than downside.

EPS Surprise (%)

Occurs when a company's reported quarterly or annual profits are above or below analysts' expectations. Here is the formula to derive % EPS Surprice:

Actual EPS - Estimated EPS
------------------------------------- x 100
Estimated EPS

Why is it Important?

Earnings surprises can have a huge impact on a company's stock price. Several studies suggest that positive earnings surprises not only lead to an immediate hike in a stock's price, but also to a gradual increase over time. Hence, it's not surprising that some companies are known for routinely beating earning projections. A negative earnings surprise will usually result in a decline in share price.

Next Day Price Change (%)

Next Regular trading session Closing price following Earnings result.

For After Market Close Earnings, It is a next trading day closing price. For Before Market Open Earnings, It is the same trading day closing price.

Why is it Important?

Next Day price change is a reaction of Earnings result.

AMC Earnings Signal a Box Office Recovery, But IMAX Is the Better Buy

Posted on Jul 21, 2026 by Chris Markoch

AMC Earnings Signal a Box Office Recovery, But IMAX Is the Better Buy

AMC Entertainment (NYSE: AMC) just posted its best quarter in over a century. But the AMC report tells investors something else, too. It’s a preview of what’s coming for IMAX Corporation (NYSE: IMAX). AMC’s numbers reflect a domestic box office that grew nearly 11% year over year, its best second quarter in seven years. IMAX theaters sit at the premium end of that recovery. And the next leg of it, driven by Christopher Nolan’s “The Odyssey,” hasn’t even hit the company’s books yet.

That timing gap is the crux of the trade. AMC already looks fairly priced for its turnaround. IMAX hasn’t yet reported the catalyst that’s filling its seats. For investors weighing the two, that difference matters more than a chart pattern.

Why IMAX’s Biggest Growth Catalyst Is Still Ahead


IMAX reports earnings on July 23. That report will cover the second quarter, which ended in June. It won’t include a dollar of revenue from “The Odyssey,” which opened this past weekend to a reported $124 million domestic debut.

That’s the opportunity. The company’s iconic premium large-format screens are booked solid for weeks. Nolan has a proven track record of filling the company’s auditoriums, and this release appears no different. None of that shows up in Wednesday’s numbers.

What investors should watch instead is guidance. Management commentary on third-quarter bookings will matter more than the trailing quarter’s results. If the company signals strong forward demand tied to “The Odyssey,” and later to “Spider-Man: Brand New Day” and “Dune: Part Three,” the stock has room to re-rate higher.

Earnings growth is the key variable. IMAX carries a leaner balance sheet than AMC and doesn’t face the same debt overhang. If it can hit EPS and free cash flow targets while flagging a strong back half, the setup looks more attractive than AMC’s, where much of the good news is already public.

AMC’s Results Support the Bull Case for IMAX Stock

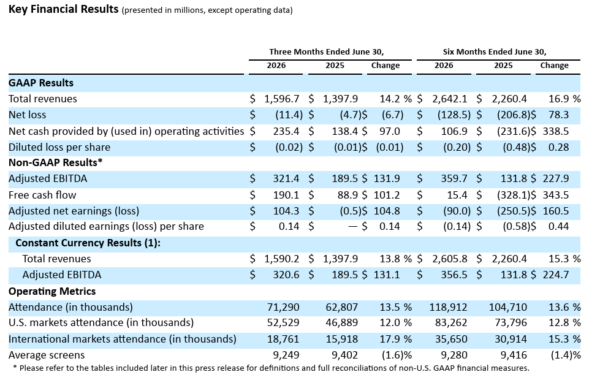
AMC’s results still matter for the IMAX thesis. Revenue climbed 14.2% to $1.6 billion. Adjusted EBITDA soared 70% to $321.4 million. U.S. attendance rose 12%, while international attendance jumped 18%. For a stock that spent years as a punchline after its 2021 meme-stock heyday, this earnings beat gives bulls a real fundamental story to point to.
imax - StockEarnings

As the largest theater chain in the world, AMC’s attendance and revenue trends are a real-time read on box office health. Both readings this quarter were strong.

Domestic attendance rose 12% year over year. International attendance rose nearly 18%, with European Adjusted EBITDA climbing over 300%. Those numbers confirm that moviegoers are back and spending more per visit on tickets and concessions.

That’s exactly the environment IMAX needs. But AMC’s stock carries extra baggage. Its stockholders’ deficit still runs past $1.4 billion, even after this quarter’s debt reduction. Diluted share count has ballooned. AMC works as a signal of industry direction. It’s a less clean way to bet on that signal than owning IMAX directly.

Technical Charts Tell Two Different Stories

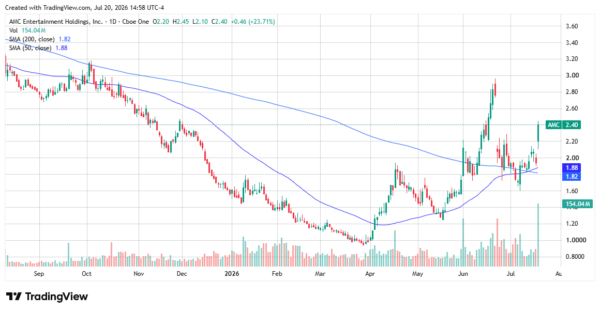
AMC’s chart shows why. The stock has responded. AMC shares recently formed a golden cross, with the 50-day moving average crossing above the 200-day. That’s often read as a bullish signal. Shares sit near $2.40, above both the 50-day and 200-day moving averages, with the golden cross intact. Volume has spiked alongside the rally, a sign of speculative interest rejoining the stock.
imax - StockEarnings

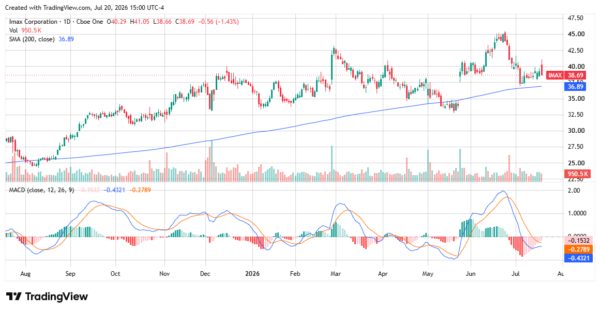
IMAX’s chart looks different. Shares trade around $38.69, still well above their 200-day moving average near $36.89. But the stock has pulled back from a recent high above $45, and the MACD has rolled over into negative territory.
imax - StockEarnings

That pullback looks more like consolidation than deterioration. It sets up a cleaner entry ahead of earnings, especially if guidance confirms the “Odyssey” tailwind. AMC’s momentum, by contrast, may already reflect most of its good news.

Why IMAX Offers More Upside After AMC’s Earnings

AMC’s turnaround is real, and its numbers offer a legitimate read on box office strength. But the stock has already re-rated. By contrast, with its biggest catalyst still ahead of its earnings report, IMAX offers the more asymmetric setup for investors chasing this theatrical rebound.


A former marketing copywriter turned freelance financial writer and market analyst. I have a passion for delivering insights to investors. I write regularly about stocks for StockEarnings and MarketBeat. Posts are not advice.

Join over 1.2M+ investors/traders who receive daily and weekly notable earnings alerts with predicted move