ajax loader

Loading...


Ride-the-Wave Strategy – Best for Stock Traders

Ride-the-Wave targets multi-day price momentum following a company’s earnings announcement (EA). With this strategy:

  1. Buy a stock one day post-EA if a stock reacts positively post-earnings:
    1. Near the close of trading the EA-day for a pre-market-EA
    2. Near the close of the following day for a post-market-EA
  2. Sell-to-close after 7-10 days, or possibly earlier if a desired price target is reached

Similarly,

  1. short a stock one day post-EA if a stock reacts negatively post-earnings:
    1. near the close of trading the EA-day for a premarket-EA
    2. near the close of the following day for a post-market-EA
  2. then buy-to-close after 7-10 days, or possibly earlier if a desired price target is reached

Important: Ride-the-Wave is predicated on significant price momentum triggered by an EA. The 7-10 day scenario is the maximum trade hold-time. If you see post EA-momentum is halted or reversed by a significant opposite move, re-evaluate your presence in the trade.

This popular StockEarnings screen below will give you a list of stocks that historically exhibit significant price momentum following an EA for the next seven days:

  1. Stocks exhibiting positive post-EA price moves are buy-candidates
  2. Stocks exhibiting negative post-EA price moves are sell/short-candidates

The screen includes those stocks whose Earnings just came out in last two days.

Screen criteria:

  1. Earnings Date Start Date : Current Date + -1 Day
  2. Earnings Date End Date : Current Date + -2 Days
  3. Predicted Move (Next Day) Max : 7%
  4. Predicted Move (On 7th Day) Min : 7%

Strategy Guideline:

  1. Buy the stock if stock has reacted positively. Short the stock if stock has reacted negatively (see above).
  2. Close the position in 7-10 days, or possibly earlier based on price move.

Volatility Crush Strategy - Best for Options Traders

The Volatility Crush strategy is used with stocks that typically experience relatively low-to-moderate price moves (≤4%) following their Earnings Announcements (EA). The basic trade idea is to sell put or call options right before the EA, collecting a credit when options premium is very high due to elevated implied volatility (IV). You then close the position right after the EA by buying the option back much cheaper due to the significant drop in IV that occurs after the mystery of the EA disappears. In assessing this trade, you need to do your homework to ensure you collect sufficient premium to make the trade worthwhile.

This trade is practical due to the low-to-moderate price-move after the EA, which generally won’t significantly affect the options price, unlike an “action” stock, which experience great price moves post-EA. With these symbols, if you’re on the right side of the price move, that’s a great thing. But if you’re on the wrong side of the move, not so great. Consequently, by minimizing the effect of the post-EA price move, you have a much better chance to profit from the reduction in IV without it being ruined by a violent price move.

For this trade, open the position either (1) the night before the EA when the company announces earnings or (2) during the EA day when it announces post-market, generally capturing IV at or close to its peak.

For this trade, open the position either (1) the night before the EA when the company announces earnings or (2) during the EA day when it announces post-market, generally capturing IV at or close to its peak.

This popular stockearnings screen will give you a list of stocks which do not react more than 4% fpost-EA. It includes only those stocks whose earnings are releasing next day.

Screen criteria:

  1. Earnings Date Start Date : Current Date + 1
  2. Earnings Date End Date : Current Date + 1
  3. Predicted Move (Next Day) Max : 4%
  4. Options Type: Weekly

Strategy Guideline:

  1. Options Strategy: Sell Call and Put
  2. Options Strike Price: Current Stock Price – (% Predicated Move x 2)
  3. Expiration Date: It should generally be the closest expiry immediately after the EA.
  4. Buy Insurance: Buying back Call and Put at Strike price which 10% lower than Sell Strike Price is optional but recommended.

Watch Video for More Detail

Volatility Rush Strategy - Best for Options Traders

The Volatility Rush takes advantage of increasing options premiums into earnings announcements (EA) caused by an anticipated rise in Implied Volatility (IV). With this strategy, Buy a Call and Put at-the-money (a long straddle) 2-3 weeks before the EA when IV is lower. Sell the position either (1) the night before the EA when the company announces earnings pre-market, or (2) during the EA day when it announces post-market, generally capturing IV at or close to its peak.

This popular screen will give you a list of stocks whose Options premiums tend to rise into Earnings. It includes only those stocks whose Earnings are at least two weeks away from today.

Screen criteria:

  1. Earnings Date Start Date : Current Date + 15 Days
  2. Earnings Date End Date : Current Date + 30 Days
  3. Predicted Move (Next Day) Min : 5%
  4. Options Type: Weekly or Monthly if that lines up with the two to three-week lead-time for entering the trade

Strategy Guideline:

  1. Buy a Straddle at or close to the money two to three weeks pre-EA.
  2. Sell the position either the night before the EA when the company announces earnings pre-market, or during the EA day when it announces post-market.
  3. Expiration date should generally be the closest expiry immediately after the EA.
  4. Straddle price should not be more 60% of predicted move.

Predicted Move (Volatility)

Similar to Implied Volatility in Options. Expected volatility % based on our Proprietary Volatility Predication Model. We are expecting that stock price will likely to reach % in either direction by the end of next trading session after Earnings are released and not necessarily the closing volatility %.

Why is it important?

    This indicator helps

  1. Knowing expected volatility in stocks after Earnings helps to decide trading stocks before Earnings Announcement.
  2. Taking Advantage of volatility collapse following Earnings Results by using Advance Options strategies such as Spread and Straddles.

Since Last Earnings

Change in share price since last Earnings release.

Why is it Important?

When share has gained more than 10% since it's last Earning release, it tends to over react to minor bad news and give up some gains if not all. So, it contains more downside volatility than upside When share has dropped more than 10% since it's last Earning release, it tends to over react to minor good news and recover some drops if not all. So, it contains more upside volatility than downside.

EPS Surprise (%)

Occurs when a company's reported quarterly or annual profits are above or below analysts' expectations. Here is the formula to derive % EPS Surprice:

Actual EPS - Estimated EPS
------------------------------------- x 100
Estimated EPS

Why is it Important?

Earnings surprises can have a huge impact on a company's stock price. Several studies suggest that positive earnings surprises not only lead to an immediate hike in a stock's price, but also to a gradual increase over time. Hence, it's not surprising that some companies are known for routinely beating earning projections. A negative earnings surprise will usually result in a decline in share price.

Next Day Price Change (%)

Next Regular trading session Closing price following Earnings result.

For After Market Close Earnings, It is a next trading day closing price. For Before Market Open Earnings, It is the same trading day closing price.

Why is it Important?

Next Day price change is a reaction of Earnings result.

Bullish Speculators Need to Keep Close Tabs on Microchip (MCHP) Stock

Posted on Jul 21, 2026 by Joshua Enomoto

Bullish Speculators Need to Keep Close Tabs on Microchip (MCHP) Stock

At first glance, microcontroller specialist Microchip Technology (NASDAQ: MCHP) won’t seem very appealing, especially to those who are risk-averse. I can’t blame them. Over the trailing month, MCHP stock has dropped more than 21%. Generally speaking, the ticker has been on a downward slide since early May and the latest escalation in Iran doesn’t exactly bode well for global stability.

Nevertheless, an argument exists that MCHP stock could be due for a reversal of fortunes. Fundamentally, it appears that Microchip stands on solid ground. However, the popular consensus is that the security has suffered from a textbook “sell the news” post-earnings reversal.

Yes, the latest fiscal fourth-quarter results were strong, with the company posting a 35.1% revenue lift on a year-over-year basis. So, what’s the problem? Basically, the explanation is that because the long-awaited recovery in industrial and automotive microcontrollers was already baked into the share price, institutional money used the strong print as a liquidity window to lock in profits, triggering a sizable fade.

Other analysts will point to the sky-high valuation metrics that MCHP stock printed during its heyday. In late June, Microchip was still trading at a price-to-sales ratio nearing 11x, whereas the semiconductor industry average landed at 8.58x. I’m not a big fan of these rearward-looking financial ratios but from a comparative standpoint, you can see why many in the market wanted to trim their exposure to a statistically bloated entity.

Still, if the smart money has anything to say, it does seem as if optimism is steadily gaining for Microchip stock. When you look at the volatility skew for the Aug. 21 options chain, the chart shows a positive-leaning “smile.” What that means is that the implied volatility (IV) for out-the-money (OTM) calls is greater than the IV for OTM puts.

In other words, while traders are paying a premium for downside protection (resulting in elevated IV on the left or put side), they are prioritizing upside convexity, as evidenced by the IV spike for calls (on the right side). This framework doesn’t guarantee upside for MCHP stock but it demonstrates that the hedging bias is more aligned with a net-bullish posture.

An Enticing Quant Signal Adds Potential Fuel for MCHP Stock


Although volatility skew may provide insights as to how other traders are managing uncertainty, it doesn’t tell us anything about what is likely to happen. For example, just because other people are loading up on auto insurance premiums doesn’t necessarily mean that they are more likely to suffer an accident; they merely fear that a financially disastrous accident may occur.

It’s the same philosophy with Microchip stock. Even if we had perfect knowledge of trader hedging activities doesn’t necessarily mean that MCHP will trade into the implications of the hedge. Instead, I believe we need to condition forward probabilities based on specific, quantitative signals.

Some might question why quant signals matter and it’s a fair inquiry. I would point to the nature of the modern equities market. Currently, price discovery is largely a consequence of major funds and institutions running algorithmic, rules-based trading protocols. This technology is necessary because of the latency penalty. If you’re late in absorbing publicly disclosed material news, you’re left paying a volatility premium of the in-demand security or derivative.
MCHP-StockEarnings

To extend this theory, it’s reasonable to believe that such algos will view quality enterprises like Microchip suffering an extended downturn as a discounted opportunity. If so, new buyers may help bolster MCHP stock, right at the time when the weak hands have been washed out. This newfound pressure could lead to a positive mean reversion, which is perhaps why MCHP’s volatility skew shows net upside convexity.

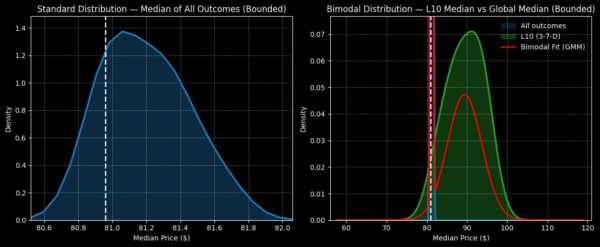
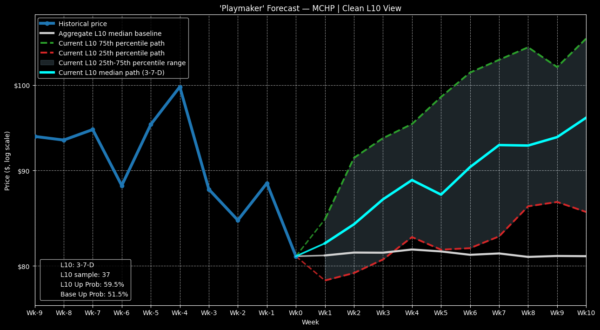
Quantitatively, we know that in the last 10 weeks, Microchip stock has printed only three up weeks, leading to a downward slope. This 3-7-D sequence — which has materialized 37 times on a rolling basis since January 2019 — has historically led to an outsized performance. Over the next 10 weeks, the expected distribution of median outcomes is between $75 and $102 (assuming a starting price of $80.96), with probability density peaking at around $91.

As a random baseline, the expected forward 10-week distribution of MCHP stock is between $80.50 and $82, with peak probability density near $81.10. We’re talking about an average positive variance of 12% when comparing peak to peak, which is stunning.

What’s more, the performance variance between the signal and the baseline is generally orderly, scaling up with each passing week in the distribution. As such, there are many options here (no pun intended).

Going for a High-Probability Setup

Despite the many choices available, I’m really digging the 80/85 bull call spread expiring Aug. 21. While this trade doesn’t have the maximum payout firepower of other ideas — offering “only” 100% — the statistics undergirding the trade add to the temptation.
MCHP-StockEarnings

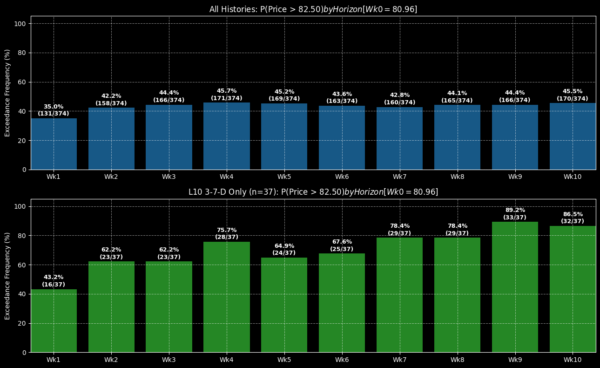
Enticingly, the 80/85 bull spread’s breakeven price is $82.50, which I believe to be a very reasonable target. However, Wall Street currently pegs the probability of profit (the likelihood of Microchip stock rising to $82.50 at expiration) at only 46.8%. Empirically, these odds should be higher.

I say that because of the 37 times that the 3-7-D quant signal has flashed, it has risen above the equivalent of the $82.50 breakeven price a total of 24 times on week 5. If we take this observation at face value, the probability of profit should be 64.9%. That’s over 1,800 basis points of “free” odds in your favor.
MCHP-StockEarnings

It’s a fancy way of saying that the 80/85 bull spread is underpriced relative to the historical risk incurred in MCHP stock under the aforementioned setup. Even better, during the times that the quant signal flashed, MCHP rose above the equivalent of the $85 second-leg strike a total of 21 times on week 5.

Basically, there may be a 56.8% chance that this spread reaches full profitability, not just breakeven. Again, we have to be careful because my model isn’t guaranteed to be the sole arbiter of truth. But if the implications are accurate, this options spread for Microchip stock could be a remarkable steal.


Joshua Enomoto is a seasoned financial writer with a strong track record of in-depth stock analysis, offering clear, insightful commentary for retail investors across all levels of expertise. Renowned for his ability to blend analytical rigor with engaging wit, Joshua's work has been featured on leading investment platforms, including TipRanks, InvestorPlace, Barchart, Benzinga, and Fintel. He was also handpicked to spearhead high-impact initiatives such as InvestorPlace's "Trade of the Day" and Benzinga’s ETF coverage. As a frequent guest expert for CGTN America, Joshua discusses a wide range of economic, societal, and consumer market trends. A graduate of U.C. San Diego, Joshua brings a thoughtful and fresh perspective to complex financial narratives, helping enterprise clients connect with their audiences. He also composes music in his spare time.

Join over 1.2M+ investors/traders who receive daily and weekly notable earnings alerts with predicted move