I’m hesitating to write this article on Caterpillar (NYSE: CAT) because the evidence that I’m going to present, in any other domain, would be considered patently ridiculous. And yet, because of the nature of modern-day equities — specifically their reflexive behaviors — CAT stock, in my humble opinion, is incredibly alluring. As always, I’ll present the data and let you decide what framework best reflects reality.
In the financial publication space, Caterpillar stock has encountered some friction. Most notably, Michael Burry of “The Big Short” fame recently shorted CAT. The reason? Burry cited concerns that the ticker has become dangerously overvalued due to the “AI infrastructure” narrative. Fundamentally, it appears that the skepticism is rooted in financial metrics, with Caterpillar incurring sky-high multiples against earnings and growth.
Because Burry commands much authority and respect for his prior exploits, his targeting of CAT stock — a security he has been historically bullish one — is a concerning sign; let’s not lie about that. However, some analysts don’t believe that the expert’s sudden bearishness is all that relevant. Caterpillar proponents often cite these core catalysts:
- Real Industrial demand: Unlike pure speculative tech plays, Caterpillar has an underlying business with genuine utility. The company’s surge is tied to actual, record-level backlogs for power generation equipment (engines and turbines) required for data centers, which are struggling with power grid limitations.
- Fundamental growth: Analysts point out that Caterpillar is not just an AI proxy; it is a diversified industrial leader with exposure to global infrastructure and mining. The company has consistently beaten earnings expectations over the last three quarters and management has projected double-digit revenue growth.
- Long-term backlog: With orders extending into 2028, the AI-driven demand for power systems is viewed by many as a multi-year trend rather than a short-term bubble.
Now, I’m not really big on highlight analysts’ consensus targets (or even opinions) because these folks have a vested interest in always presenting optimistic framing. Even political views can influence how experts make market calls. That said, some have suggested that the market is pricing in structural shifts in global electricity demand rather than just irrational exuberance.
So, within the mainstream ecosystem, the bearish argument against CAT stock — as high-profile as it may be — isn’t universally accepted.
Building an Empirical Case for CAT Stock
Still, even when writing nearly 400 words of the fundamentals surrounding Caterpillar stock, knowledge of this information won’t necessarily make you a better investor or trader. Why? Because we can reasonably assume that all public data has been digested by the algorithms and rules-based protocols that dominate Wall Street.
It has to be this way. Institutions play the latency game, where participants operate in the paradigm of nanoseconds. Speed, especially being first to the trade, is what matters. Otherwise, if you’re late, you’re buying a volatility premium, meaning that the target security or derivative becomes unnecessarily more expensive.
Obviously, retail traders can’t play the latency game. By the time they can physically read the opening line of a financial statement, they are already too late. However, they can play the forecasting game for the simple fact that nobody knows what the future will hold. That’s why if we have a probabilistic model to better determine future outcomes, it may give us an edge.
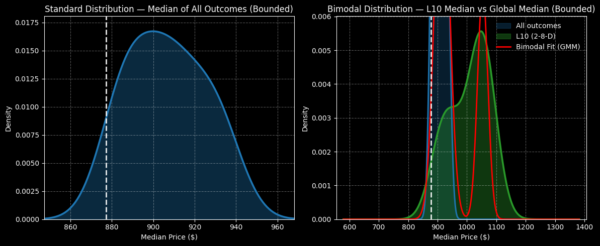
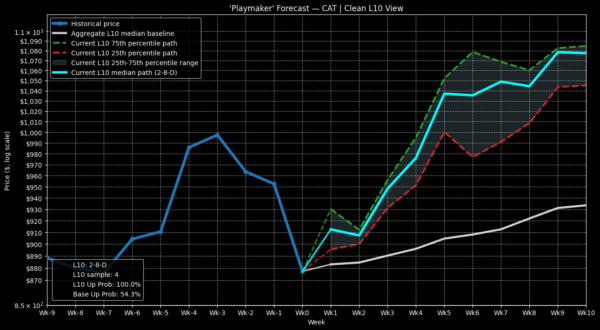
Looking at CAT stock, the key reason why I’m intrigued by the bullish speculative position is the structural footprint that the ticker left behind. In the past 10 weeks, CAT printed only two up weeks, leading to an overall downward slope. Conditioned for this 2-8-D sequence — which has only materialized four times on a rolling basis since January 2019 — the observed distribution over the next 10 weeks (assuming a starting price of $877.17) is $800 to $1,200, with peak probability density of $1,040.
What’s significant about this datapoint is that if we traded CAT stock randomly, our expected 10-week distribution would land between $840 and $965, with probability density peaking at around $900. On average, we’re talking about a 15.55% positive variance between the signal and the random baseline.
Of course, the reason I’m not pounding the table on CAT stock is a sample size of four is not reliable. There are simply too many factors that can easily distort the underlying implications. Still, the speculative position would state that the algos I mentioned earlier may interpret this rare quantitative sequence as a discounted opportunity. As such, I’m not completely dismissing this potential trade.
Deciphering a Specific Options Spread
Looking at the forecasted pathway, if we were to assume a continuation of observed trends following the flashing of the 2-8-D signal, then the week 3 median endpoint would be nearly $950. As I don’t have as much confidence that CAT stock will hit this number (due to the small sample size), a possibly balanced idea would be to consider the 920/935 bull call spread expiring Aug. 7.
For this trade to be fully profitable, Caterpillar stock must rise through the $935 strike at expiration, which would generate a maximum payout of over 75%. What’s fascinating about this trade, though, is the breakeven price of $928.55. Currently, the market assigns a probability of profit (the likelihood of CAT stock reaching breakeven at expiration) of only 33.5%.
These odds stem from the Black-Scholes model, which utilizes implied volatility as the inputted variable and is run through a formula that assumes risk-neutrality and lognormality. Subsequently, the 33.5% figure is the implied probability in terms of the distance CAT stock must travel (in standard deviations) from the current spot price to the target price. It’s an elegant calculation but also a theoretical one.
With my model, I base my findings on what you see is what you get. Of the four times that the 2-8-D signal has flashed, CAT stock has reached or exceeded the equivalent of $928.55 on week 3 a total of three times. Therefore, setting aside the small-sample issue, the probability of profit has been observed to be 75%.
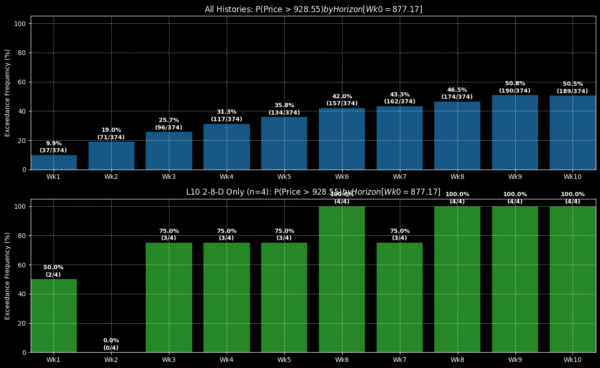
You know what else? If we set the exceedance ratio indicator to $935 (the second-leg strike), the observed probability of full profit is also 75%. As a caveat, we’ll never know for sure if the market will abide by prior patterns. But if it does, CAT stock is worth closer investigation.

