ajax loader

Loading...


Ride-the-Wave Strategy – Best for Stock Traders

Ride-the-Wave targets multi-day price momentum following a company’s earnings announcement (EA). With this strategy:

  1. Buy a stock one day post-EA if a stock reacts positively post-earnings:
    1. Near the close of trading the EA-day for a pre-market-EA
    2. Near the close of the following day for a post-market-EA
  2. Sell-to-close after 7-10 days, or possibly earlier if a desired price target is reached

Similarly,

  1. short a stock one day post-EA if a stock reacts negatively post-earnings:
    1. near the close of trading the EA-day for a premarket-EA
    2. near the close of the following day for a post-market-EA
  2. then buy-to-close after 7-10 days, or possibly earlier if a desired price target is reached

Important: Ride-the-Wave is predicated on significant price momentum triggered by an EA. The 7-10 day scenario is the maximum trade hold-time. If you see post EA-momentum is halted or reversed by a significant opposite move, re-evaluate your presence in the trade.

This popular StockEarnings screen below will give you a list of stocks that historically exhibit significant price momentum following an EA for the next seven days:

  1. Stocks exhibiting positive post-EA price moves are buy-candidates
  2. Stocks exhibiting negative post-EA price moves are sell/short-candidates

The screen includes those stocks whose Earnings just came out in last two days.

Screen criteria:

  1. Earnings Date Start Date : Current Date + -1 Day
  2. Earnings Date End Date : Current Date + -2 Days
  3. Predicted Move (Next Day) Max : 7%
  4. Predicted Move (On 7th Day) Min : 7%

Strategy Guideline:

  1. Buy the stock if stock has reacted positively. Short the stock if stock has reacted negatively (see above).
  2. Close the position in 7-10 days, or possibly earlier based on price move.

Volatility Crush Strategy - Best for Options Traders

The Volatility Crush strategy is used with stocks that typically experience relatively low-to-moderate price moves (≤4%) following their Earnings Announcements (EA). The basic trade idea is to sell put or call options right before the EA, collecting a credit when options premium is very high due to elevated implied volatility (IV). You then close the position right after the EA by buying the option back much cheaper due to the significant drop in IV that occurs after the mystery of the EA disappears. In assessing this trade, you need to do your homework to ensure you collect sufficient premium to make the trade worthwhile.

This trade is practical due to the low-to-moderate price-move after the EA, which generally won’t significantly affect the options price, unlike an “action” stock, which experience great price moves post-EA. With these symbols, if you’re on the right side of the price move, that’s a great thing. But if you’re on the wrong side of the move, not so great. Consequently, by minimizing the effect of the post-EA price move, you have a much better chance to profit from the reduction in IV without it being ruined by a violent price move.

For this trade, open the position either (1) the night before the EA when the company announces earnings or (2) during the EA day when it announces post-market, generally capturing IV at or close to its peak.

For this trade, open the position either (1) the night before the EA when the company announces earnings or (2) during the EA day when it announces post-market, generally capturing IV at or close to its peak.

This popular stockearnings screen will give you a list of stocks which do not react more than 4% fpost-EA. It includes only those stocks whose earnings are releasing next day.

Screen criteria:

  1. Earnings Date Start Date : Current Date + 1
  2. Earnings Date End Date : Current Date + 1
  3. Predicted Move (Next Day) Max : 4%
  4. Options Type: Weekly

Strategy Guideline:

  1. Options Strategy: Sell Call and Put
  2. Options Strike Price: Current Stock Price – (% Predicated Move x 2)
  3. Expiration Date: It should generally be the closest expiry immediately after the EA.
  4. Buy Insurance: Buying back Call and Put at Strike price which 10% lower than Sell Strike Price is optional but recommended.

Watch Video for More Detail

Volatility Rush Strategy - Best for Options Traders

The Volatility Rush takes advantage of increasing options premiums into earnings announcements (EA) caused by an anticipated rise in Implied Volatility (IV). With this strategy, Buy a Call and Put at-the-money (a long straddle) 2-3 weeks before the EA when IV is lower. Sell the position either (1) the night before the EA when the company announces earnings pre-market, or (2) during the EA day when it announces post-market, generally capturing IV at or close to its peak.

This popular screen will give you a list of stocks whose Options premiums tend to rise into Earnings. It includes only those stocks whose Earnings are at least two weeks away from today.

Screen criteria:

  1. Earnings Date Start Date : Current Date + 15 Days
  2. Earnings Date End Date : Current Date + 30 Days
  3. Predicted Move (Next Day) Min : 5%
  4. Options Type: Weekly or Monthly if that lines up with the two to three-week lead-time for entering the trade

Strategy Guideline:

  1. Buy a Straddle at or close to the money two to three weeks pre-EA.
  2. Sell the position either the night before the EA when the company announces earnings pre-market, or during the EA day when it announces post-market.
  3. Expiration date should generally be the closest expiry immediately after the EA.
  4. Straddle price should not be more 60% of predicted move.

Predicted Move (Volatility)

Similar to Implied Volatility in Options. Expected volatility % based on our Proprietary Volatility Predication Model. We are expecting that stock price will likely to reach % in either direction by the end of next trading session after Earnings are released and not necessarily the closing volatility %.

Why is it important?

    This indicator helps

  1. Knowing expected volatility in stocks after Earnings helps to decide trading stocks before Earnings Announcement.
  2. Taking Advantage of volatility collapse following Earnings Results by using Advance Options strategies such as Spread and Straddles.

Since Last Earnings

Change in share price since last Earnings release.

Why is it Important?

When share has gained more than 10% since it's last Earning release, it tends to over react to minor bad news and give up some gains if not all. So, it contains more downside volatility than upside When share has dropped more than 10% since it's last Earning release, it tends to over react to minor good news and recover some drops if not all. So, it contains more upside volatility than downside.

EPS Surprise (%)

Occurs when a company's reported quarterly or annual profits are above or below analysts' expectations. Here is the formula to derive % EPS Surprice:

Actual EPS - Estimated EPS
------------------------------------- x 100
Estimated EPS

Why is it Important?

Earnings surprises can have a huge impact on a company's stock price. Several studies suggest that positive earnings surprises not only lead to an immediate hike in a stock's price, but also to a gradual increase over time. Hence, it's not surprising that some companies are known for routinely beating earning projections. A negative earnings surprise will usually result in a decline in share price.

Next Day Price Change (%)

Next Regular trading session Closing price following Earnings result.

For After Market Close Earnings, It is a next trading day closing price. For Before Market Open Earnings, It is the same trading day closing price.

Why is it Important?

Next Day price change is a reaction of Earnings result.

Howmet Aerospace Stock Falls as Wall Street Defends the Dip

Posted on Sep 01, 2026 by Ian Cooper

Howmet Aerospace Stock Falls as Wall Street Defends the Dip

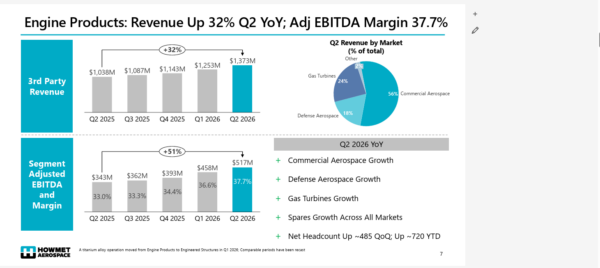
Howmet Aerospace (NYSE: HWM) dropped after SpaceX (NASDAQ: SPCX) said it plans to manufacture its own castings for industrial gas turbines, raising concerns that the move could threaten one of Howmet’s fastest-growing businesses. Those turbines are increasingly important to the data-center industry, where rapidly expanding artificial-intelligence workloads are creating enormous electricity requirements.

But two Wall Street banks see the selloff as an opportunity to buy the stock. Citigroup (NYSE: C) reiterated its buy rating on Howmet, opened an “upside 30-day Catalyst Watch” on the stock and maintained a $329 price target. Bernstein reiterated an outperform rating and set a $328 price objective.

SpaceX News Creates a Buying Opportunity for HWM Stock


“We see this as a unique and likely short-lived opportunity in shares,” Citi said, arguing that 

SpaceX’s decision could actually reinforce the importance of Howmet’s products while highlighting the extraordinary level of demand facing the industrial gas turbine, or IGT, industry.

“We believe the [SpaceX news] (1) reinforces the critical nature of HWM parts and (2) illustrates the exceptional demand HWM faces in [industrial gas turbines] above/beyond its ~$2B revenue target,” they added.

SpaceX’s move reflects the broader pressure companies are facing to secure additional power-generation capacity. Industrial gas turbines can provide a relatively fast and reliable source of electricity for large data centers, but manufacturers and their suppliers have struggled to keep pace with rapidly rising demand.

For investors, however, the question is whether SpaceX’s vertical-integration plans will take business away from Howmet.

Bernstein believes the risk is limited. Howmet controls more than 50% of the market for IGT blade castings and has long-term agreements with major turbine manufacturers, giving it a deeply entrenched position in the supply chain. Bernstein said those relationships should make it difficult for SpaceX to displace Howmet, even if SpaceX successfully brings some manufacturing capabilities in-house.

Howmet’s IGT Casting Dominance Gives HWM Stock an Edge

“We see little risk to Howmet from the SpaceX announcement; instead, we see a positive Message,” Bernstein added. They also pointed to Howmet’s long-term agreements with every major IGT producer and the company’s ongoing efforts to expand production capacity.

In addition, SpaceX could remain a Howmet customer.

Citi also sees a reason not to assume that SpaceX’s decision means the end of its relationship with Howmet or other suppliers. Even if SpaceX ultimately manufactures some IGT components itself, the company is likely to remain a customer within the broader turbine supply chain, according to the firm.

That distinction could prove important. SpaceX may be seeking to eliminate specific bottlenecks rather than completely replace the existing industrial ecosystem. Bringing certain components in-house could allow the company to accelerate production while continuing to source other specialized parts from established suppliers.
howmet - StockEarnings

HWM Stock Technical Analysis: A Key Test at $250

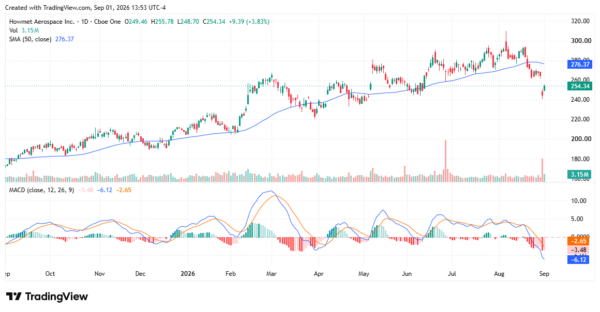
Howmet Aerospace stock is showing some technical damage following the SpaceX news, but the chart also puts the recent decline into perspective. HWM dropped to around $254 on Sept. 1, down sharply from the stock’s recent highs and now well below its 50-day simple moving average of $276.37.

The first level to watch is the $248-$250 area, which roughly corresponds with the low of the latest selloff. A successful hold above that zone could give bulls a chance to stabilize the stock and begin a recovery. If HWM breaks decisively below it, the next important support area appears closer to $240, where the stock found support during previous pullbacks.

On the upside, the $260-$265 area is the first hurdle. A move back above that zone would improve the near-term technical picture, while reclaiming the 50-day SMA near $276 would provide a much stronger bullish signal.

The MACD is also flashing caution. The MACD line is around -6.12, below the signal line near -2.65, while the histogram is negative. That indicates bearish momentum has strengthened and suggests investors should look for evidence of stabilization before assuming the pullback has run its course.

Still, the longer-term chart remains considerably more constructive than the latest decline suggests. HWM spent much of the past year in an upward trend, with the 50-day moving average generally rising as the stock established a series of higher highs and higher lows. The current move, therefore, looks like an important test of that broader trend rather than definitive evidence that it has ended.

For HWM stock, $250 is the key near-term line in the sand. Holding that level could support a rebound toward $260-$265 and eventually the 50-day moving average. A sustained break below $250, however, would increase the odds of a deeper retracement.
howmet - StockEarnings

SpaceX May Signal More IGT Demand, Not Less

In the end, Citi and Bernstein argue that the selloff may have gone too far. With a dominant share of the IGT blade-casting market, long-term customer relationships and multiple capacity expansions underway, Howmet remains positioned to benefit from rising demand.

SpaceX’s decision to build more turbine components could therefore be less of a threat than a signal of the enormous growth opportunity ahead. For investors, the immediate concern is competition. For Wall Street analysts, the bigger takeaway is demand, and the latter may ultimately prove far more important for Howmet’s earnings outlook.


Over the last 26 years, he’s taught thousands of investors how to trade news flow and herd mentality using a unique blend of technical and fundamental analysis. Cooper was among the few analysts to spot the financial crisis of 2008, the top of subprime and Alt-A, the death of Lehman Brothers, Bear Stearns, and New Century Financial, and even the Dow’s collapse to 6,500, as well as its recovery. He even called for gold to rally well above $1.500 when it traded under $600. At the moment, Cooper makes use of technical, fundamental and news analysis, to help individual investors grow their wealth. He’s a firm believer that hard work and thorough research will lead to investment success.

Join over 1.2M+ investors/traders who receive daily and weekly notable earnings alerts with predicted move