When you think about Goldman Sachs (NYSE: GS), a range of opinions is likely to materialize. However, very few would arguably consider GS stock an exciting options trade. As one of the world’s premier financial institutions, it’s too much of a sector stalwart to generate the kind of volatility needed to make a short-term trade intriguing.
That could change over the next few weeks. Why? An unusual intersection between technical and quantitative arguments makes the bull case for Goldman Sachs stock intriguing.
First, I must admit that discussing a technical argument for GS stock is somewhat hypocritical on my part. Over the past few months, I’ve cast doubt on the discipline, mainly because it seems to require subjective reasoning. That’s especially relevant when you start talking about pattern-based technicals, such as head and shoulders, bullish wedges and other funky formations.
In other words, a lot of this stuff comes down to the eye of the beholder. There’s no real empirical definition of what constitutes a legitimate pattern from a fake one. That’s a key reason why I prefer quantitative reasoning. Despite the inherent objections, my methodology can be repeated by others to reach identical observational conclusions.
 Source: StockCharts.com
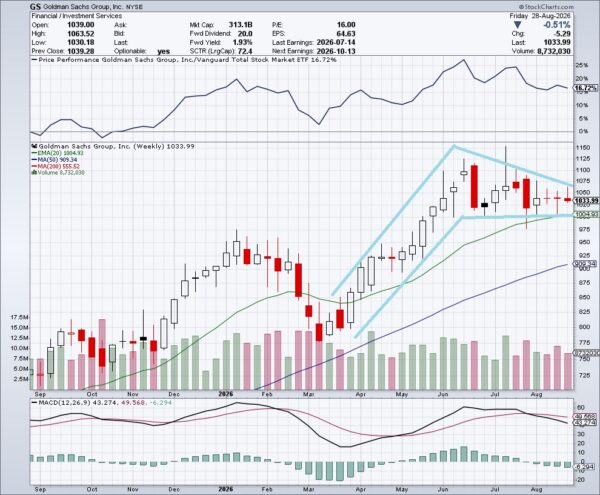
Nevertheless, if you’ll grant an exemption this time around, it appears that GS stock — on the weekly candlestick chart — has printed a bullish flag formation. Basically, GS enjoyed an initial rally between late March and mid-June of this year, setting up the flagpole. Since mid-June, however, GS has been stuck in a declining consolidation pattern, forming the flag.
Under standard technical theory, this consolidation phase is creating pent-up bullishness. At the apex of the flag, Goldman stock has a high probability of breaking out. Therefore, it may behoove a speculative trader to consider buying GS now before the positive swing.
Order Flow Imbalance Offers a Possible Opportunity for GS Stock
While the visual implication of the bullish flag formation may seem convincing, it raises several obvious questions; predominantly, what really constitutes a bullish flag? Even if we were to grant the proposition, there’s another question to consider, which is, what does “high probability” mean?
Are we talking 60% likelihood of moving higher? Or 70%? And what is the average magnitude of this breakout? 5%? 15%? These are unresolved questions and to my knowledge, there are no concrete, satisfying answers. In this case, I’m going to treat the technical case of Goldman Sachs stock as a pleasant coincidence.
For me, the stronger argument is order flow imbalance. Yes, I will concede that the period starting from mid-June does appear to be a consolidation phase. But quantitatively, among these last 10 weeks (candlesticks), only three of them were positive, thus creating a downward slope across the period (from opening price to closing price).
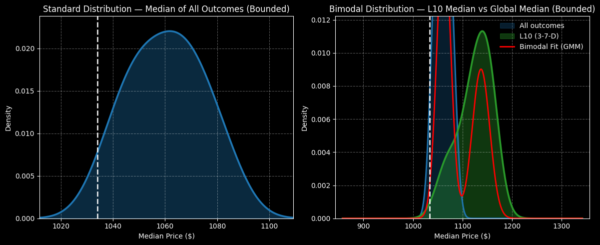
It’s not so much that this 3-7-D quant sequence is inherently unique or special. At the end of the day, all it really specifies is a static cadence at some point in time. The significance comes in the historical response to this sequence. Whenever this signal has flashed in the charts, the median response of GS stock has been unusually robust relative to the random baseline performance.
I’ll get into the specific odds later, but the inductive implication of the data suggests that by the Sep. 18 expiration date, the median endpoint forecast is around $1,120. It follows, then, that a less-aggressive price target would be probabilistically more favorable for the debit-side options trader.
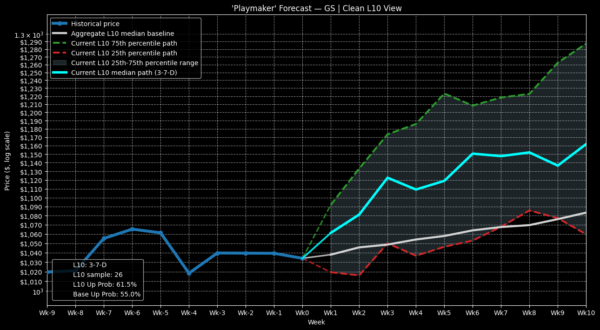
As such, I’m looking at the 1090/1100 bull call spread expiring Sep. 18. This is an aggressive trade, requiring a net debit (cash outlay) of $415. However, if GS stock manages to rise through the $1,100 second-leg strike at expiration, the maximum profit would be $585, a payout of nearly 141%.
Sounds great, right? Well, Wall Street has a clear warning: it’s not a probabilistically likely trade.
Casting Doubt on the Random Walk Argument for Goldman Sachs Stock
One of the immediate problems is the breakeven price. Set at $1,094.15, GS stock must rise almost 6% to trigger the breakeven threshold. Wall Street finds that to be a dubious prospect, setting the probability of profit (breakeven) at only 19.8%.
What compounds the difficulty is implied volatility (IV) or the kinetic potential of the target security. For Goldman Sachs stock, IV for the Sep. 18 options chain is currently 28.52%, which by itself is rather low. Moreover, it’s modestly lower than the historic volatility of 30.91%. Even against historical norms, GS is not expected to move much, making a 6% jump to break even a low-probability affair.
Perhaps worst of all, OptionCharts’ Probability Distribution screener rates the odds of GS stock reaching the second-leg strike at expiration at only 16.31%. You don’t have to run an expected value (EV) calculation to recognize the dilemma. Because you would be losing far more times than winning, your losses would compound quickly if you ran the 1090/1100 bull spread multiple times across parallel universes.
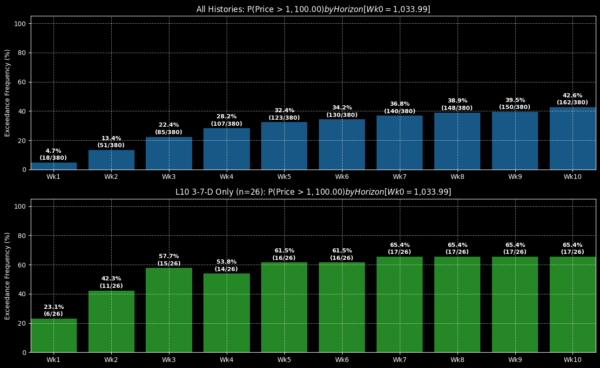
Fundamentally, though, the core reason why the probabilities above are so low is due to the geometric Brownian motion assumption. Essentially, the Street’s options pricing mechanism presupposes that all securities undergo a random walk between now and the selected expiration date. Because of this artificial framework, the environment from which the odds are calculated is risk-neutral.
I don’t see GS stock that way. Rather, I view the current 3-7-D setup as implying that GS is (heavily) risk-biased (i.e. nonrandom). Since January 2019, the aforementioned signal has only materialized 26 times on a rolling basis. But on the third week of the signal flashing, Goldman Sachs stock has risen above the equivalent of the $1,100 strike price a total of 15 times.
If we were to take this observation at face value, the conditioned probability of full profitability would stand at 57.7%, not 16.31% as is assumed under a random framework.
Caveats to the Inductive Approach
Of course, to justify the 1090/1100 bull call spread, I’m inferring that the median outcome of GS stock following the aforementioned signal makes the trade more rational than what Wall Street is advertising. However, to make this inference, I’m relying on an inductive model — and inductive models are unfortunately vulnerable to the black swan risk.
Just because a pattern has been established in the past does not necessarily mean it will repeat in the future. That said, I also believe we’re justified in using the inductive approach in lieu of a lack of other alternatives.
If we didn’t use induction, arguably most of us would be left relying on Wall Street’s probabilities to make trading decisions. But as I demonstrated, the random walk framework may not be the most accurate forecast of reality. While I can’t absolutely say that induction is the most superior model, I believe it helps us reduce uncertainty and provide tools for forward risk management.

