ajax loader

Loading...


Ride-the-Wave Strategy – Best for Stock Traders

Ride-the-Wave targets multi-day price momentum following a company’s earnings announcement (EA). With this strategy:

  1. Buy a stock one day post-EA if a stock reacts positively post-earnings:
    1. Near the close of trading the EA-day for a pre-market-EA
    2. Near the close of the following day for a post-market-EA
  2. Sell-to-close after 7-10 days, or possibly earlier if a desired price target is reached

Similarly,

  1. short a stock one day post-EA if a stock reacts negatively post-earnings:
    1. near the close of trading the EA-day for a premarket-EA
    2. near the close of the following day for a post-market-EA
  2. then buy-to-close after 7-10 days, or possibly earlier if a desired price target is reached

Important: Ride-the-Wave is predicated on significant price momentum triggered by an EA. The 7-10 day scenario is the maximum trade hold-time. If you see post EA-momentum is halted or reversed by a significant opposite move, re-evaluate your presence in the trade.

This popular StockEarnings screen below will give you a list of stocks that historically exhibit significant price momentum following an EA for the next seven days:

  1. Stocks exhibiting positive post-EA price moves are buy-candidates
  2. Stocks exhibiting negative post-EA price moves are sell/short-candidates

The screen includes those stocks whose Earnings just came out in last two days.

Screen criteria:

  1. Earnings Date Start Date : Current Date + -1 Day
  2. Earnings Date End Date : Current Date + -2 Days
  3. Predicted Move (Next Day) Max : 7%
  4. Predicted Move (On 7th Day) Min : 7%

Strategy Guideline:

  1. Buy the stock if stock has reacted positively. Short the stock if stock has reacted negatively (see above).
  2. Close the position in 7-10 days, or possibly earlier based on price move.

Volatility Crush Strategy - Best for Options Traders

The Volatility Crush strategy is used with stocks that typically experience relatively low-to-moderate price moves (≤4%) following their Earnings Announcements (EA). The basic trade idea is to sell put or call options right before the EA, collecting a credit when options premium is very high due to elevated implied volatility (IV). You then close the position right after the EA by buying the option back much cheaper due to the significant drop in IV that occurs after the mystery of the EA disappears. In assessing this trade, you need to do your homework to ensure you collect sufficient premium to make the trade worthwhile.

This trade is practical due to the low-to-moderate price-move after the EA, which generally won’t significantly affect the options price, unlike an “action” stock, which experience great price moves post-EA. With these symbols, if you’re on the right side of the price move, that’s a great thing. But if you’re on the wrong side of the move, not so great. Consequently, by minimizing the effect of the post-EA price move, you have a much better chance to profit from the reduction in IV without it being ruined by a violent price move.

For this trade, open the position either (1) the night before the EA when the company announces earnings or (2) during the EA day when it announces post-market, generally capturing IV at or close to its peak.

For this trade, open the position either (1) the night before the EA when the company announces earnings or (2) during the EA day when it announces post-market, generally capturing IV at or close to its peak.

This popular stockearnings screen will give you a list of stocks which do not react more than 4% fpost-EA. It includes only those stocks whose earnings are releasing next day.

Screen criteria:

  1. Earnings Date Start Date : Current Date + 1
  2. Earnings Date End Date : Current Date + 1
  3. Predicted Move (Next Day) Max : 4%
  4. Options Type: Weekly

Strategy Guideline:

  1. Options Strategy: Sell Call and Put
  2. Options Strike Price: Current Stock Price – (% Predicated Move x 2)
  3. Expiration Date: It should generally be the closest expiry immediately after the EA.
  4. Buy Insurance: Buying back Call and Put at Strike price which 10% lower than Sell Strike Price is optional but recommended.

Watch Video for More Detail

Volatility Rush Strategy - Best for Options Traders

The Volatility Rush takes advantage of increasing options premiums into earnings announcements (EA) caused by an anticipated rise in Implied Volatility (IV). With this strategy, Buy a Call and Put at-the-money (a long straddle) 2-3 weeks before the EA when IV is lower. Sell the position either (1) the night before the EA when the company announces earnings pre-market, or (2) during the EA day when it announces post-market, generally capturing IV at or close to its peak.

This popular screen will give you a list of stocks whose Options premiums tend to rise into Earnings. It includes only those stocks whose Earnings are at least two weeks away from today.

Screen criteria:

  1. Earnings Date Start Date : Current Date + 15 Days
  2. Earnings Date End Date : Current Date + 30 Days
  3. Predicted Move (Next Day) Min : 5%
  4. Options Type: Weekly or Monthly if that lines up with the two to three-week lead-time for entering the trade

Strategy Guideline:

  1. Buy a Straddle at or close to the money two to three weeks pre-EA.
  2. Sell the position either the night before the EA when the company announces earnings pre-market, or during the EA day when it announces post-market.
  3. Expiration date should generally be the closest expiry immediately after the EA.
  4. Straddle price should not be more 60% of predicted move.

Predicted Move (Volatility)

Similar to Implied Volatility in Options. Expected volatility % based on our Proprietary Volatility Predication Model. We are expecting that stock price will likely to reach % in either direction by the end of next trading session after Earnings are released and not necessarily the closing volatility %.

Why is it important?

    This indicator helps

  1. Knowing expected volatility in stocks after Earnings helps to decide trading stocks before Earnings Announcement.
  2. Taking Advantage of volatility collapse following Earnings Results by using Advance Options strategies such as Spread and Straddles.

Since Last Earnings

Change in share price since last Earnings release.

Why is it Important?

When share has gained more than 10% since it's last Earning release, it tends to over react to minor bad news and give up some gains if not all. So, it contains more downside volatility than upside When share has dropped more than 10% since it's last Earning release, it tends to over react to minor good news and recover some drops if not all. So, it contains more upside volatility than downside.

EPS Surprise (%)

Occurs when a company's reported quarterly or annual profits are above or below analysts' expectations. Here is the formula to derive % EPS Surprice:

Actual EPS - Estimated EPS
------------------------------------- x 100
Estimated EPS

Why is it Important?

Earnings surprises can have a huge impact on a company's stock price. Several studies suggest that positive earnings surprises not only lead to an immediate hike in a stock's price, but also to a gradual increase over time. Hence, it's not surprising that some companies are known for routinely beating earning projections. A negative earnings surprise will usually result in a decline in share price.

Next Day Price Change (%)

Next Regular trading session Closing price following Earnings result.

For After Market Close Earnings, It is a next trading day closing price. For Before Market Open Earnings, It is the same trading day closing price.

Why is it Important?

Next Day price change is a reaction of Earnings result.

Halliburton Stock: Christmas in July for Patient Contrarians

Posted on Jul 22, 2026 by Chris Markoch

Halliburton Stock: Christmas in July for Patient Contrarians

Halliburton (NYSE: HAL) stock just did something that should make contrarian investors start looking for mistletoe, or at least some sleigh bells. Shares of the oilfield services giant fell 5.47% on July 21, closing at $33.19, even after the company beat expectations on both revenue and earnings.

That’s not a typo. Halliburton posted $5.7 billion in second-quarter revenue, up from $5.4 billion in Q1, with adjusted earnings of $0.55 per diluted share. Free cash flow came in at $668 million, and management returned roughly $200 million to shareholders through buybacks.

So why the selloff? Investors zeroed in on one soft spot: Middle East/Asia revenue fell 2% sequentially to $1.3 billion, as the ongoing U.S.-Iran conflict disrupted activity in Kuwait, Iraq, and Qatar. That single data point overshadowed a much stronger overall picture, including a 7% sequential jump in North America revenue and broad-based international growth.

This looks like a classic case of short-term traders punishing a stock for a narrow, headline-grabbing detail while ignoring the underlying trend. For long-term investors, that overreaction may have just created an attractive entry point. The structural case for Halliburton’s business, domestic drilling, infrastructure buildout, and energy demand tied to reshoring hasn’t changed. If anything, this quarter reinforced it. Below, I’ll walk through why the dip looks overdone, what the charts say, and where the bear case could still bite.

Why the Middle East Headline Masks a Stronger Story


Halliburton’s Q2 numbers were, in aggregate, strong. Total revenue grew 6% sequentially, and operating income rose to $778 million, up from $679 million in Q1. The Completion and Production segment grew 6%, while Drilling and Evaluation grew 5%. Those aren’t the numbers of a company in distress.

The Middle East softness is real, but it’s regional, not structural. Halliburton’s own release attributes the decline directly to “the ongoing geopolitical conflict in the Middle East,” naming Kuwait, Iraq, and Qatar specifically. That’s a geopolitical disruption, not a demand problem or a competitive loss.

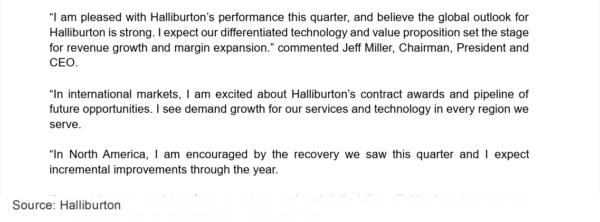
Meanwhile, North America revenue jumped 7% sequentially to $2.3 billion, which CEO Jeff Miller called an “encouraged” recovery with “incremental improvements through the year” expected. Europe/Africa/CIS revenue also grew 19% sequentially, driven by North Sea activity and new well construction in Namibia and Egypt.
Halliburton - StockEarnings

Markets often punish the one bad number in an otherwise solid report. That’s arguably what happened here. Investors who can look past a single regional disruption may be getting Halliburton at a discount.

The Structural Demand Story for U.S. Energy Isn’t Going Away

The conventional wisdom says oil prices will crater once the U.S.-Iran conflict ends. Two things complicate that narrative. First, there’s no clear end date in sight; the conflict has proven more durable than many expected.

Second, and more important, is what happens to U.S. energy demand regardless of geopolitics. AI data centers get most of the attention, but they’re only part of the story. Roads, bridges, and grid upgrades all require energy-intensive materials and construction. Add in the billions of dollars companies are committing to reshoring manufacturing onto U.S. soil, and the demand backdrop for oil and gas looks durable, not fragile.

Halliburton doesn’t need $100 oil to thrive. It needs producers to keep drilling. As long as North America activity keeps recovering, as this quarter suggests it is, the company’s core business should hold up. Rivals like SLB (NYSE: SLB) and Baker Hughes (NASDAQ: BKR) face a similar setup.

What the Charts Say About Halliburton’s Next Move

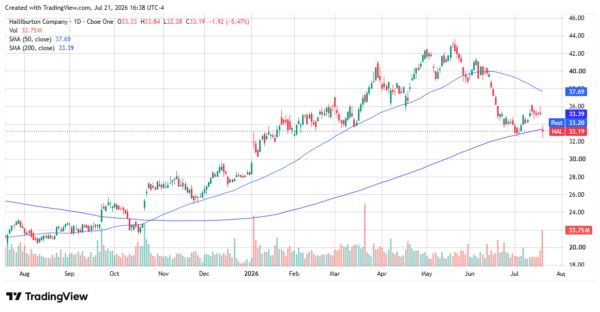
Halliburton’s chart shows a stock in a clear downtrend since its May 2026 high near $43, now trading below both its 50-day ($37.69) and 200-day ($33.39) moving averages. Tuesday’s post-earnings drop pushed shares to $33.19, right at the 200-day line, an important technical level.

That line has acted as support before, most notably during the September-October 2025 base-building period. A decisive close below $33 on heavy volume, and Tuesday’s 33.75 million shares traded were well above average, would be a bearish signal worth watching. But if support holds here, the setup favors a stabilization attempt rather than a deeper breakdown. Watch this level closely over the next several sessions.
halliburton - StockEarnings

What Could Go Wrong With This Thesis

No bull case is complete without acknowledging the risks. The most obvious: if the U.S. targets Iranian oil infrastructure directly, or if Iran and its proxies retaliate against energy infrastructure elsewhere, Halliburton’s “muddy” Middle East picture could turn into something worse. Regional disruption could spread beyond Kuwait, Iraq, and Qatar.

There’s also a demand-side risk that cuts in the opposite direction. If the conflict resolves and OPEC+ supply returns to the market faster than expected, the U.S. could find itself oversupplied. That would be good news for consumers at the pump, but bad news for oilfield services companies like Halliburton, which depend on producers maintaining active drilling programs.

Neither scenario is playing out yet. Q2 results showed North America recovering, not retreating. But investors should recognize that both a Middle East escalation and a global oversupply scenario are live possibilities, and either could pressure the stock further before this thesis plays out.

The Bottom Line for Halliburton Investors

Halliburton’s selloff looks like a case of traders overreacting to one soft data point in an otherwise strong quarter. The company beat on revenue, grew operating income, and generated healthy free cash flow, all while returning capital to shareholders through buybacks and dividends.

The bear case isn’t imaginary. Escalation risk in the Middle East and a potential oversupply scenario are both real. But neither is likely to show up in the numbers for at least the next two quarters. Until then, Halliburton’s core North American recovery and structural U.S. energy demand story remains intact.

For long-term, contrarian-minded investors, this dip may be less a warning sign and more an early Christmas gift.


A former marketing copywriter turned freelance financial writer and market analyst. I have a passion for delivering insights to investors. I write regularly about stocks for StockEarnings and MarketBeat. Posts are not advice.

Join over 1.2M+ investors/traders who receive daily and weekly notable earnings alerts with predicted move