ajax loader

Loading...


Ride-the-Wave Strategy – Best for Stock Traders

Ride-the-Wave targets multi-day price momentum following a company’s earnings announcement (EA). With this strategy:

  1. Buy a stock one day post-EA if a stock reacts positively post-earnings:
    1. Near the close of trading the EA-day for a pre-market-EA
    2. Near the close of the following day for a post-market-EA
  2. Sell-to-close after 7-10 days, or possibly earlier if a desired price target is reached

Similarly,

  1. short a stock one day post-EA if a stock reacts negatively post-earnings:
    1. near the close of trading the EA-day for a premarket-EA
    2. near the close of the following day for a post-market-EA
  2. then buy-to-close after 7-10 days, or possibly earlier if a desired price target is reached

Important: Ride-the-Wave is predicated on significant price momentum triggered by an EA. The 7-10 day scenario is the maximum trade hold-time. If you see post EA-momentum is halted or reversed by a significant opposite move, re-evaluate your presence in the trade.

This popular StockEarnings screen below will give you a list of stocks that historically exhibit significant price momentum following an EA for the next seven days:

  1. Stocks exhibiting positive post-EA price moves are buy-candidates
  2. Stocks exhibiting negative post-EA price moves are sell/short-candidates

The screen includes those stocks whose Earnings just came out in last two days.

Screen criteria:

  1. Earnings Date Start Date : Current Date + -1 Day
  2. Earnings Date End Date : Current Date + -2 Days
  3. Predicted Move (Next Day) Max : 7%
  4. Predicted Move (On 7th Day) Min : 7%

Strategy Guideline:

  1. Buy the stock if stock has reacted positively. Short the stock if stock has reacted negatively (see above).
  2. Close the position in 7-10 days, or possibly earlier based on price move.

Volatility Crush Strategy - Best for Options Traders

The Volatility Crush strategy is used with stocks that typically experience relatively low-to-moderate price moves (≤4%) following their Earnings Announcements (EA). The basic trade idea is to sell put or call options right before the EA, collecting a credit when options premium is very high due to elevated implied volatility (IV). You then close the position right after the EA by buying the option back much cheaper due to the significant drop in IV that occurs after the mystery of the EA disappears. In assessing this trade, you need to do your homework to ensure you collect sufficient premium to make the trade worthwhile.

This trade is practical due to the low-to-moderate price-move after the EA, which generally won’t significantly affect the options price, unlike an “action” stock, which experience great price moves post-EA. With these symbols, if you’re on the right side of the price move, that’s a great thing. But if you’re on the wrong side of the move, not so great. Consequently, by minimizing the effect of the post-EA price move, you have a much better chance to profit from the reduction in IV without it being ruined by a violent price move.

For this trade, open the position either (1) the night before the EA when the company announces earnings or (2) during the EA day when it announces post-market, generally capturing IV at or close to its peak.

For this trade, open the position either (1) the night before the EA when the company announces earnings or (2) during the EA day when it announces post-market, generally capturing IV at or close to its peak.

This popular stockearnings screen will give you a list of stocks which do not react more than 4% fpost-EA. It includes only those stocks whose earnings are releasing next day.

Screen criteria:

  1. Earnings Date Start Date : Current Date + 1
  2. Earnings Date End Date : Current Date + 1
  3. Predicted Move (Next Day) Max : 4%
  4. Options Type: Weekly

Strategy Guideline:

  1. Options Strategy: Sell Call and Put
  2. Options Strike Price: Current Stock Price – (% Predicated Move x 2)
  3. Expiration Date: It should generally be the closest expiry immediately after the EA.
  4. Buy Insurance: Buying back Call and Put at Strike price which 10% lower than Sell Strike Price is optional but recommended.

Watch Video for More Detail

Volatility Rush Strategy - Best for Options Traders

The Volatility Rush takes advantage of increasing options premiums into earnings announcements (EA) caused by an anticipated rise in Implied Volatility (IV). With this strategy, Buy a Call and Put at-the-money (a long straddle) 2-3 weeks before the EA when IV is lower. Sell the position either (1) the night before the EA when the company announces earnings pre-market, or (2) during the EA day when it announces post-market, generally capturing IV at or close to its peak.

This popular screen will give you a list of stocks whose Options premiums tend to rise into Earnings. It includes only those stocks whose Earnings are at least two weeks away from today.

Screen criteria:

  1. Earnings Date Start Date : Current Date + 15 Days
  2. Earnings Date End Date : Current Date + 30 Days
  3. Predicted Move (Next Day) Min : 5%
  4. Options Type: Weekly or Monthly if that lines up with the two to three-week lead-time for entering the trade

Strategy Guideline:

  1. Buy a Straddle at or close to the money two to three weeks pre-EA.
  2. Sell the position either the night before the EA when the company announces earnings pre-market, or during the EA day when it announces post-market.
  3. Expiration date should generally be the closest expiry immediately after the EA.
  4. Straddle price should not be more 60% of predicted move.

Predicted Move (Volatility)

Similar to Implied Volatility in Options. Expected volatility % based on our Proprietary Volatility Predication Model. We are expecting that stock price will likely to reach % in either direction by the end of next trading session after Earnings are released and not necessarily the closing volatility %.

Why is it important?

    This indicator helps

  1. Knowing expected volatility in stocks after Earnings helps to decide trading stocks before Earnings Announcement.
  2. Taking Advantage of volatility collapse following Earnings Results by using Advance Options strategies such as Spread and Straddles.

Since Last Earnings

Change in share price since last Earnings release.

Why is it Important?

When share has gained more than 10% since it's last Earning release, it tends to over react to minor bad news and give up some gains if not all. So, it contains more downside volatility than upside When share has dropped more than 10% since it's last Earning release, it tends to over react to minor good news and recover some drops if not all. So, it contains more upside volatility than downside.

EPS Surprise (%)

Occurs when a company's reported quarterly or annual profits are above or below analysts' expectations. Here is the formula to derive % EPS Surprice:

Actual EPS - Estimated EPS
------------------------------------- x 100
Estimated EPS

Why is it Important?

Earnings surprises can have a huge impact on a company's stock price. Several studies suggest that positive earnings surprises not only lead to an immediate hike in a stock's price, but also to a gradual increase over time. Hence, it's not surprising that some companies are known for routinely beating earning projections. A negative earnings surprise will usually result in a decline in share price.

Next Day Price Change (%)

Next Regular trading session Closing price following Earnings result.

For After Market Close Earnings, It is a next trading day closing price. For Before Market Open Earnings, It is the same trading day closing price.

Why is it Important?

Next Day price change is a reaction of Earnings result.

Wayfair Could Have Powerful Upside, Bernstein Says

Posted on Aug 14, 2026 by Ian Cooper

Wayfair Could Have Powerful Upside, Bernstein Says

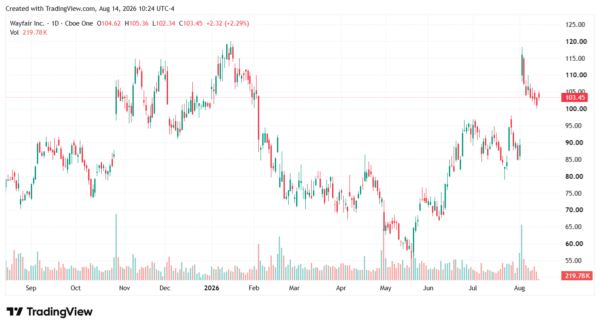
Keep an eye on Wayfair (NYSE: W). According to analysts at Bernstein (NYSE: AB), there’s more upside ahead. In fact, the firm believes investors may still be underestimating the company’s momentum, upgrading the stock from Market Perform to Outperform, with a $125 price target.

W shares have already had a strong August after posting better-than-expected second-quarter results. Total revenue reached $3.5 billion, up 7.5% from the same period last year. U.S. revenue jumped 8.7% to $3.1 billion. International revenue declined 1.3%, showing that most of the company’s current growth is coming from the U.S.

Orders were another bright spot.

The company delivered 10.6 million orders during the quarter, an increase of 6% from a year earlier. CEO Niraj Shah said the company experienced its strongest sequential order growth for a second quarter since 2020.

The number of active customers also increased. Wayfair ended June with 21.7 million active customers, up 3.3% year over year. Customers are also spending more, with revenue per active customer increasing 4.2% to $596.

The U.S. Business Is Leading the Way


Bernstein analyst Nikhil Devnani believes Wayfair’s U.S. performance is especially important.

The broader furniture market is not growing much, yet the company’s U.S. revenue is increasing at a high-single-digit rate. That means the company appears to be gaining market share from competitors. Management said U.S. revenue growth was the strongest it has seen during the entire post-COVID period.

Several parts of the business are performing particularly well. Wayfair’s specialty retail brands grew nearly 20% during the quarter, while luxury brand Perigold grew more than 35%.

In addition, the company generated $242 million in adjusted EBITDA during the quarter, representing a 6.9% margin. That was the company’s strongest margin performance since 2021.

Free cash flow was also impressive. Wayfair generated $301 million of free cash flow during the quarter, compared with negative free cash flow in the previous quarter.

What Comes Next?

Wayfair’s outlook for the third quarter is encouraging. Management expects high-single-digit revenue growth for the quarter. Importantly, that forecast does not assume that the broader economy or furniture market will suddenly improve.

Instead, Wayfair expects its own initiatives to drive growth. These include its loyalty program, Wayfair Verified, and its physical store strategy.

The company expects adjusted EBITDA margins of roughly 6% to 7% in the third quarter. Management is also confident that it can eventually reach a 10% margin and potentially go beyond that level. Bernstein also believes the company’s improving cost discipline could make future revenue growth more valuable. 

The Bottom Line For Wayfair

Wayfair’s second-quarter results provide several reasons for investors to pay attention.

Revenue is growing, U.S. market share appears to be increasing, customers are becoming more active, and profitability and cash flow are improving. Specialty brands and Perigold are adding another source of growth, while new initiatives such as loyalty programs and stores could provide additional momentum.

For now, management appears confident. With third-quarter revenue growth expected to remain in the high single digits and a longer-term goal of reaching double-digit margins, the company is showing signs that its business may be on a stronger path than many investors previously expected. That combination of growth, improving profitability, and market-share gains is why Wayfair may be a stock worth keeping an eye on.
wayfair-StockEarnings

Over the last 26 years, he’s taught thousands of investors how to trade news flow and herd mentality using a unique blend of technical and fundamental analysis. Cooper was among the few analysts to spot the financial crisis of 2008, the top of subprime and Alt-A, the death of Lehman Brothers, Bear Stearns, and New Century Financial, and even the Dow’s collapse to 6,500, as well as its recovery. He even called for gold to rally well above $1.500 when it traded under $600. At the moment, Cooper makes use of technical, fundamental and news analysis, to help individual investors grow their wealth. He’s a firm believer that hard work and thorough research will lead to investment success.

Join over 1.2M+ investors/traders who receive daily and weekly notable earnings alerts with predicted move
